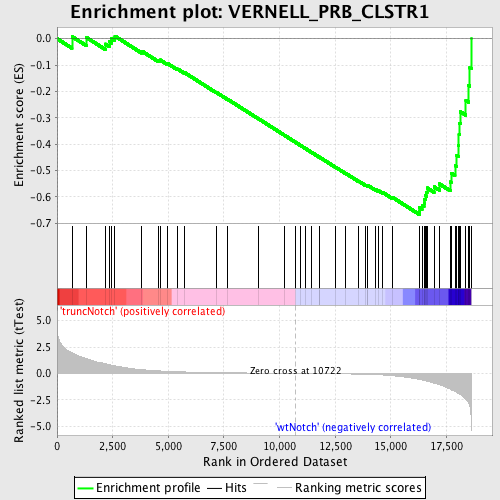
Profile of the Running ES Score & Positions of GeneSet Members on the Rank Ordered List
| Dataset | Set_03_truncNotch_versus_wtNotch.phenotype_truncNotch_versus_wtNotch.cls #truncNotch_versus_wtNotch |
| Phenotype | phenotype_truncNotch_versus_wtNotch.cls#truncNotch_versus_wtNotch |
| Upregulated in class | wtNotch |
| GeneSet | VERNELL_PRB_CLSTR1 |
| Enrichment Score (ES) | -0.6673902 |
| Normalized Enrichment Score (NES) | -1.7850436 |
| Nominal p-value | 0.0 |
| FDR q-value | 0.04436095 |
| FWER p-Value | 0.252 |
| PROBE | DESCRIPTION (from dataset) | GENE SYMBOL | GENE_TITLE | RANK IN GENE LIST | RANK METRIC SCORE | RUNNING ES | CORE ENRICHMENT | |
|---|---|---|---|---|---|---|---|---|
| 1 | EGR1 | 4610347 | 670 | 1.942 | 0.0081 | No | ||
| 2 | CCNE1 | 110064 | 1324 | 1.384 | 0.0044 | No | ||
| 3 | CENPK | 1740722 6200068 | 2165 | 0.917 | -0.0200 | No | ||
| 4 | ASF1B | 6590706 | 2342 | 0.835 | -0.0105 | No | ||
| 5 | ATAD2 | 870242 2260687 | 2457 | 0.780 | 0.0011 | No | ||
| 6 | DEK | 1050451 4560037 | 2600 | 0.722 | 0.0099 | No | ||
| 7 | ANKRD25 | 4850102 | 3799 | 0.353 | -0.0467 | No | ||
| 8 | CHAF1A | 6040647 | 4543 | 0.239 | -0.0812 | No | ||
| 9 | JPH1 | 610739 | 4629 | 0.230 | -0.0806 | No | ||
| 10 | RECQL4 | 540551 | 4966 | 0.195 | -0.0943 | No | ||
| 11 | CDCA5 | 5670131 | 5416 | 0.156 | -0.1149 | No | ||
| 12 | MCM8 | 6130743 | 5717 | 0.135 | -0.1280 | No | ||
| 13 | RFC3 | 1980600 | 7145 | 0.072 | -0.2032 | No | ||
| 14 | FANCA | 6130070 | 7650 | 0.058 | -0.2291 | No | ||
| 15 | EPS8 | 7050204 | 9057 | 0.028 | -0.3042 | No | ||
| 16 | CCDC5 | 2480040 | 10229 | 0.008 | -0.3671 | No | ||
| 17 | KCNK1 | 1050068 | 10696 | 0.000 | -0.3922 | No | ||
| 18 | BTG3 | 7050079 | 10953 | -0.004 | -0.4059 | No | ||
| 19 | PTX3 | 870309 3520102 | 11154 | -0.007 | -0.4165 | No | ||
| 20 | FST | 1110600 | 11433 | -0.012 | -0.4312 | No | ||
| 21 | VRK1 | 5890603 6900347 | 11771 | -0.018 | -0.4489 | No | ||
| 22 | CDKN1A | 4050088 6400706 | 11801 | -0.019 | -0.4501 | No | ||
| 23 | ESCO2 | 1170010 | 12528 | -0.034 | -0.4884 | No | ||
| 24 | HUNK | 7100139 | 12972 | -0.047 | -0.5112 | No | ||
| 25 | SLBP | 6220601 | 13541 | -0.069 | -0.5402 | No | ||
| 26 | PBX3 | 1300424 3710577 6180575 | 13879 | -0.086 | -0.5564 | No | ||
| 27 | HMGB2 | 2640603 | 13950 | -0.091 | -0.5581 | No | ||
| 28 | FBXO5 | 2630551 | 13963 | -0.092 | -0.5567 | No | ||
| 29 | SNTB2 | 2630014 5390035 | 14305 | -0.118 | -0.5724 | No | ||
| 30 | BLM | 520619 5570170 | 14458 | -0.131 | -0.5776 | No | ||
| 31 | EZH2 | 6130605 6380524 | 14633 | -0.150 | -0.5835 | No | ||
| 32 | NPAT | 3800594 4670026 | 15073 | -0.214 | -0.6023 | No | ||
| 33 | MCM7 | 3290292 5220056 | 16282 | -0.569 | -0.6544 | Yes | ||
| 34 | BARD1 | 3170348 | 16293 | -0.574 | -0.6419 | Yes | ||
| 35 | CDC25A | 3800184 | 16404 | -0.617 | -0.6338 | Yes | ||
| 36 | E2F2 | 5270609 5570377 7000465 | 16494 | -0.660 | -0.6236 | Yes | ||
| 37 | RAB27A | 450019 | 16522 | -0.673 | -0.6097 | Yes | ||
| 38 | CNOT6L | 4590333 | 16569 | -0.692 | -0.5965 | Yes | ||
| 39 | DONSON | 4780541 6130010 | 16611 | -0.725 | -0.5822 | Yes | ||
| 40 | MELK | 130022 5220537 | 16632 | -0.736 | -0.5665 | Yes | ||
| 41 | TFDP1 | 1980112 | 16945 | -0.926 | -0.5623 | Yes | ||
| 42 | RRM2 | 6350059 6940162 | 17182 | -1.046 | -0.5512 | Yes | ||
| 43 | TMPO | 4050494 | 17673 | -1.489 | -0.5437 | Yes | ||
| 44 | MCM4 | 2760673 5420711 | 17712 | -1.538 | -0.5108 | Yes | ||
| 45 | RAD51AP1 | 4050736 6370528 | 17885 | -1.714 | -0.4811 | Yes | ||
| 46 | FANCL | 2060520 5220066 5270164 | 17965 | -1.793 | -0.4445 | Yes | ||
| 47 | RRM1 | 4150433 | 18035 | -1.872 | -0.4056 | Yes | ||
| 48 | POLD3 | 6400278 | 18063 | -1.899 | -0.3639 | Yes | ||
| 49 | PCNA | 940754 | 18090 | -1.941 | -0.3212 | Yes | ||
| 50 | SKP2 | 360711 380093 4810368 | 18133 | -2.012 | -0.2776 | Yes | ||
| 51 | DCK | 6900411 | 18375 | -2.451 | -0.2349 | Yes | ||
| 52 | EED | 2320373 | 18492 | -2.783 | -0.1778 | Yes | ||
| 53 | RFC4 | 3800082 6840142 | 18552 | -3.081 | -0.1109 | Yes | ||
| 54 | CDCA4 | 5890315 6110487 | 18614 | -5.026 | 0.0001 | Yes |

