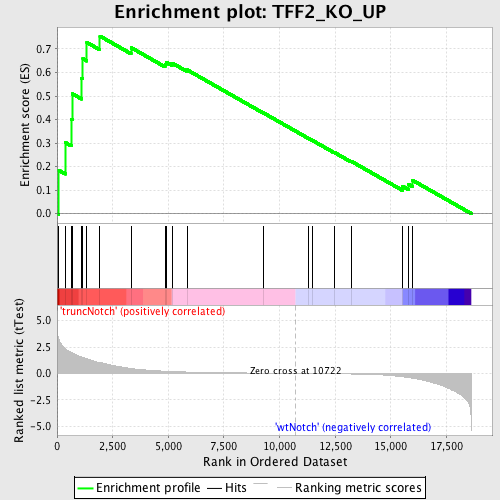
Profile of the Running ES Score & Positions of GeneSet Members on the Rank Ordered List
| Dataset | Set_03_truncNotch_versus_wtNotch.phenotype_truncNotch_versus_wtNotch.cls #truncNotch_versus_wtNotch |
| Phenotype | phenotype_truncNotch_versus_wtNotch.cls#truncNotch_versus_wtNotch |
| Upregulated in class | truncNotch |
| GeneSet | TFF2_KO_UP |
| Enrichment Score (ES) | 0.7546311 |
| Normalized Enrichment Score (NES) | 1.6188895 |
| Nominal p-value | 0.0068610637 |
| FDR q-value | 0.13957746 |
| FWER p-Value | 0.926 |
| PROBE | DESCRIPTION (from dataset) | GENE SYMBOL | GENE_TITLE | RANK IN GENE LIST | RANK METRIC SCORE | RUNNING ES | CORE ENRICHMENT | |
|---|---|---|---|---|---|---|---|---|
| 1 | CRIP1 | 4590377 | 68 | 3.274 | 0.1846 | Yes | ||
| 2 | TAP1 | 4050047 | 372 | 2.324 | 0.3020 | Yes | ||
| 3 | TFF3 | 1580129 | 638 | 1.979 | 0.4016 | Yes | ||
| 4 | PSMB8 | 2850707 | 692 | 1.918 | 0.5091 | Yes | ||
| 5 | CCL8 | 3870010 | 1101 | 1.535 | 0.5754 | Yes | ||
| 6 | IRF7 | 1570605 | 1159 | 1.493 | 0.6582 | Yes | ||
| 7 | DGKA | 5720152 5890328 | 1337 | 1.374 | 0.7278 | Yes | ||
| 8 | LTB | 3990672 | 1925 | 1.016 | 0.7546 | Yes | ||
| 9 | MS4A1 | 4210598 | 3326 | 0.456 | 0.7056 | No | ||
| 10 | SAMHD1 | 2350338 5390451 | 4854 | 0.207 | 0.6353 | No | ||
| 11 | BCAT2 | 5890112 | 4901 | 0.201 | 0.6444 | No | ||
| 12 | KDELR2 | 450465 6900095 | 5170 | 0.176 | 0.6402 | No | ||
| 13 | RBP2 | 2060097 | 5849 | 0.127 | 0.6110 | No | ||
| 14 | ABCG2 | 6370056 | 9275 | 0.024 | 0.4282 | No | ||
| 15 | PTPN22 | 1690647 7100239 | 11282 | -0.009 | 0.3209 | No | ||
| 16 | DPEP1 | 5080014 | 11467 | -0.012 | 0.3117 | No | ||
| 17 | SLC2A2 | 5130537 5720722 6770079 | 12450 | -0.033 | 0.2608 | No | ||
| 18 | APOA4 | 4120451 | 13214 | -0.056 | 0.2230 | No | ||
| 19 | CD52 | 5910242 | 15525 | -0.315 | 0.1169 | No | ||
| 20 | OGFR | 5700397 | 15790 | -0.398 | 0.1255 | No | ||
| 21 | GNB1 | 2120397 | 15975 | -0.459 | 0.1420 | No |

