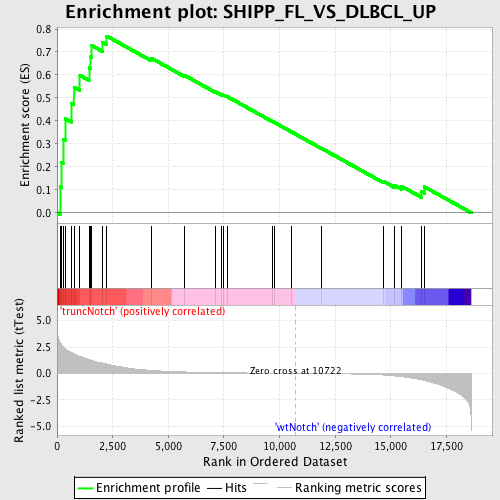
Profile of the Running ES Score & Positions of GeneSet Members on the Rank Ordered List
| Dataset | Set_03_truncNotch_versus_wtNotch.phenotype_truncNotch_versus_wtNotch.cls #truncNotch_versus_wtNotch |
| Phenotype | phenotype_truncNotch_versus_wtNotch.cls#truncNotch_versus_wtNotch |
| Upregulated in class | truncNotch |
| GeneSet | SHIPP_FL_VS_DLBCL_UP |
| Enrichment Score (ES) | 0.7691222 |
| Normalized Enrichment Score (NES) | 1.7335149 |
| Nominal p-value | 0.0017035775 |
| FDR q-value | 0.06197512 |
| FWER p-Value | 0.246 |
| PROBE | DESCRIPTION (from dataset) | GENE SYMBOL | GENE_TITLE | RANK IN GENE LIST | RANK METRIC SCORE | RUNNING ES | CORE ENRICHMENT | |
|---|---|---|---|---|---|---|---|---|
| 1 | GPR18 | 2640551 | 134 | 2.913 | 0.1132 | Yes | ||
| 2 | CLU | 5420075 | 211 | 2.667 | 0.2194 | Yes | ||
| 3 | HES1 | 4810280 | 269 | 2.504 | 0.3198 | Yes | ||
| 4 | CIRBP | 1850408 | 382 | 2.305 | 0.4091 | Yes | ||
| 5 | PDCD1 | 4120082 | 641 | 1.976 | 0.4769 | Yes | ||
| 6 | RAPSN | 610110 2370162 | 759 | 1.848 | 0.5470 | Yes | ||
| 7 | INPP1 | 670368 | 1026 | 1.595 | 0.5987 | Yes | ||
| 8 | TRIB2 | 4120605 | 1435 | 1.321 | 0.6313 | Yes | ||
| 9 | ZMYND11 | 630181 2570019 4850138 5360040 | 1519 | 1.258 | 0.6789 | Yes | ||
| 10 | CD3D | 2810739 | 1543 | 1.243 | 0.7290 | Yes | ||
| 11 | GLIPR1 | 3360750 | 2035 | 0.980 | 0.7431 | Yes | ||
| 12 | DNASE1L3 | 670086 | 2235 | 0.888 | 0.7691 | Yes | ||
| 13 | TRAF5 | 3290064 | 4237 | 0.278 | 0.6730 | No | ||
| 14 | STX16 | 70315 | 5708 | 0.136 | 0.5995 | No | ||
| 15 | HSPA1L | 4010538 | 7122 | 0.073 | 0.5265 | No | ||
| 16 | TXK | 2320338 | 7397 | 0.065 | 0.5145 | No | ||
| 17 | TCEAL1 | 870577 | 7492 | 0.062 | 0.5120 | No | ||
| 18 | ANK2 | 6510546 | 7637 | 0.058 | 0.5066 | No | ||
| 19 | SEPP1 | 450273 | 9702 | 0.017 | 0.3963 | No | ||
| 20 | RHOH | 130184 | 9767 | 0.015 | 0.3935 | No | ||
| 21 | POU6F1 | 6200168 | 10518 | 0.003 | 0.3533 | No | ||
| 22 | CD40LG | 3120270 | 11900 | -0.020 | 0.2798 | No | ||
| 23 | ITGA4 | 2470739 | 14648 | -0.151 | 0.1383 | No | ||
| 24 | LY9 | 3360315 4070292 | 15169 | -0.234 | 0.1200 | No | ||
| 25 | CD69 | 380167 4730088 | 15481 | -0.303 | 0.1158 | No | ||
| 26 | CD180 | 360048 1410440 2850440 | 16373 | -0.604 | 0.0928 | No | ||
| 27 | TCF20 | 1190338 1240520 4070594 4810440 | 16515 | -0.671 | 0.1130 | No |

