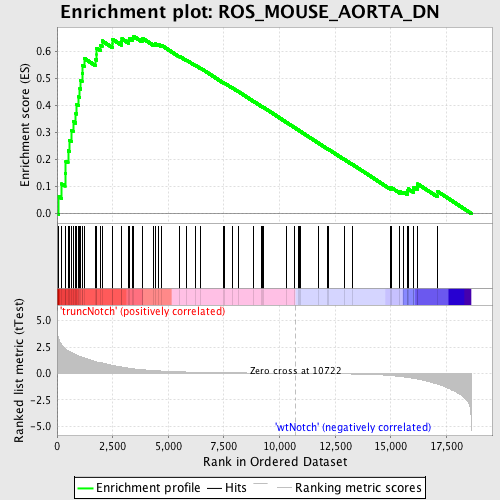
Profile of the Running ES Score & Positions of GeneSet Members on the Rank Ordered List
| Dataset | Set_03_truncNotch_versus_wtNotch.phenotype_truncNotch_versus_wtNotch.cls #truncNotch_versus_wtNotch |
| Phenotype | phenotype_truncNotch_versus_wtNotch.cls#truncNotch_versus_wtNotch |
| Upregulated in class | truncNotch |
| GeneSet | ROS_MOUSE_AORTA_DN |
| Enrichment Score (ES) | 0.65663147 |
| Normalized Enrichment Score (NES) | 1.7276251 |
| Nominal p-value | 0.0 |
| FDR q-value | 0.056368243 |
| FWER p-Value | 0.272 |
| PROBE | DESCRIPTION (from dataset) | GENE SYMBOL | GENE_TITLE | RANK IN GENE LIST | RANK METRIC SCORE | RUNNING ES | CORE ENRICHMENT | |
|---|---|---|---|---|---|---|---|---|
| 1 | CRIP1 | 4590377 | 68 | 3.274 | 0.0629 | Yes | ||
| 2 | CLU | 5420075 | 211 | 2.667 | 0.1094 | Yes | ||
| 3 | GPX3 | 1340450 | 356 | 2.360 | 0.1496 | Yes | ||
| 4 | SLC25A1 | 4050402 | 394 | 2.282 | 0.1940 | Yes | ||
| 5 | CYBA | 4760739 | 491 | 2.152 | 0.2326 | Yes | ||
| 6 | PTGIS | 6620411 | 553 | 2.071 | 0.2714 | Yes | ||
| 7 | NPNT | 130301 | 637 | 1.981 | 0.3072 | Yes | ||
| 8 | CSRP1 | 2810403 | 725 | 1.880 | 0.3407 | Yes | ||
| 9 | SERPING1 | 5550440 | 842 | 1.761 | 0.3702 | Yes | ||
| 10 | TPM1 | 130673 | 883 | 1.728 | 0.4032 | Yes | ||
| 11 | MGP | 6900736 | 974 | 1.640 | 0.4317 | Yes | ||
| 12 | ALAS2 | 6550176 | 1022 | 1.598 | 0.4616 | Yes | ||
| 13 | CAPZB | 520300 | 1052 | 1.576 | 0.4921 | Yes | ||
| 14 | PMP22 | 4010239 6550072 | 1123 | 1.521 | 0.5192 | Yes | ||
| 15 | S100A6 | 1690204 | 1146 | 1.504 | 0.5486 | Yes | ||
| 16 | BHLHB2 | 7040603 | 1217 | 1.463 | 0.5745 | Yes | ||
| 17 | FXYD5 | 4060301 6590400 | 1736 | 1.123 | 0.5694 | Yes | ||
| 18 | S100A9 | 7050528 | 1770 | 1.091 | 0.5898 | Yes | ||
| 19 | RBP1 | 1690072 | 1773 | 1.088 | 0.6118 | Yes | ||
| 20 | CD9 | 4730041 | 1956 | 1.005 | 0.6224 | Yes | ||
| 21 | CD14 | 5570600 | 2022 | 0.987 | 0.6390 | Yes | ||
| 22 | CPE | 2940441 | 2498 | 0.767 | 0.6290 | Yes | ||
| 23 | GADD45B | 2350408 | 2500 | 0.766 | 0.6445 | Yes | ||
| 24 | ELN | 5080347 | 2895 | 0.602 | 0.6355 | Yes | ||
| 25 | IGFBP5 | 2360592 | 2913 | 0.595 | 0.6467 | Yes | ||
| 26 | EMP3 | 1500722 1570039 | 3228 | 0.486 | 0.6396 | Yes | ||
| 27 | MMP9 | 580338 | 3236 | 0.483 | 0.6490 | Yes | ||
| 28 | IL10RB | 2900025 | 3399 | 0.439 | 0.6492 | Yes | ||
| 29 | ACTB | 1660736 2030204 2060215 5050047 | 3426 | 0.433 | 0.6566 | Yes | ||
| 30 | CTSS | 1740056 | 3822 | 0.349 | 0.6424 | No | ||
| 31 | BGN | 4730176 | 3851 | 0.346 | 0.6479 | No | ||
| 32 | MEF2A | 2350041 3360128 6040180 | 4341 | 0.266 | 0.6270 | No | ||
| 33 | ANXA3 | 5570494 | 4416 | 0.257 | 0.6282 | No | ||
| 34 | OGN | 3710326 3800193 | 4534 | 0.240 | 0.6268 | No | ||
| 35 | SYN1 | 4920301 7050440 | 4710 | 0.221 | 0.6218 | No | ||
| 36 | ACTG1 | 540215 | 5501 | 0.151 | 0.5823 | No | ||
| 37 | RPL18 | 6380181 3870195 | 5827 | 0.129 | 0.5674 | No | ||
| 38 | ORM2 | 2100048 | 6202 | 0.109 | 0.5495 | No | ||
| 39 | ATF3 | 1940546 | 6450 | 0.097 | 0.5381 | No | ||
| 40 | CD5L | 4070605 | 7473 | 0.062 | 0.4843 | No | ||
| 41 | DSTN | 3140592 | 7545 | 0.061 | 0.4817 | No | ||
| 42 | ENAH | 1690292 5700300 | 7869 | 0.052 | 0.4653 | No | ||
| 43 | IL1R2 | 1410600 | 8147 | 0.046 | 0.4513 | No | ||
| 44 | HIF1A | 5670605 | 8830 | 0.032 | 0.4152 | No | ||
| 45 | ARG2 | 6940463 | 9169 | 0.026 | 0.3975 | No | ||
| 46 | RCN2 | 840324 | 9218 | 0.025 | 0.3954 | No | ||
| 47 | SEPX1 | 3710041 5270403 | 9279 | 0.024 | 0.3927 | No | ||
| 48 | ALDH1A1 | 6520706 | 10328 | 0.006 | 0.3363 | No | ||
| 49 | MYH11 | 7100273 | 10648 | 0.001 | 0.3191 | No | ||
| 50 | RGS2 | 1090736 | 10839 | -0.002 | 0.3089 | No | ||
| 51 | CD34 | 6650270 | 10872 | -0.002 | 0.3073 | No | ||
| 52 | BTG3 | 7050079 | 10953 | -0.004 | 0.3030 | No | ||
| 53 | PHLDB2 | 6590685 | 11743 | -0.017 | 0.2608 | No | ||
| 54 | PON1 | 2260128 | 12139 | -0.026 | 0.2401 | No | ||
| 55 | LIMS1 | 110138 1450398 | 12180 | -0.027 | 0.2384 | No | ||
| 56 | SFRP2 | 4850097 | 12899 | -0.045 | 0.2006 | No | ||
| 57 | HDC | 4150463 | 13288 | -0.059 | 0.1809 | No | ||
| 58 | NFKBIZ | 2970450 | 14989 | -0.200 | 0.0933 | No | ||
| 59 | PTPN23 | 50059 130110 | 15035 | -0.207 | 0.0951 | No | ||
| 60 | IL1B | 2640364 | 15409 | -0.286 | 0.0808 | No | ||
| 61 | PTGES3 | 2190440 2680524 | 15558 | -0.323 | 0.0794 | No | ||
| 62 | RPS5 | 580093 | 15743 | -0.382 | 0.0772 | No | ||
| 63 | ARL6IP2 | 770494 4590176 6620427 | 15747 | -0.382 | 0.0849 | No | ||
| 64 | ARG1 | 840707 | 15778 | -0.392 | 0.0912 | No | ||
| 65 | PKP4 | 3710400 5890097 | 16012 | -0.470 | 0.0882 | No | ||
| 66 | LCP1 | 4280397 | 16029 | -0.475 | 0.0970 | No | ||
| 67 | EXOSC7 | 520538 | 16197 | -0.537 | 0.0989 | No | ||
| 68 | SAT1 | 4570463 | 16206 | -0.540 | 0.1094 | No | ||
| 69 | CGGBP1 | 4810053 | 17101 | -1.005 | 0.0817 | No |

