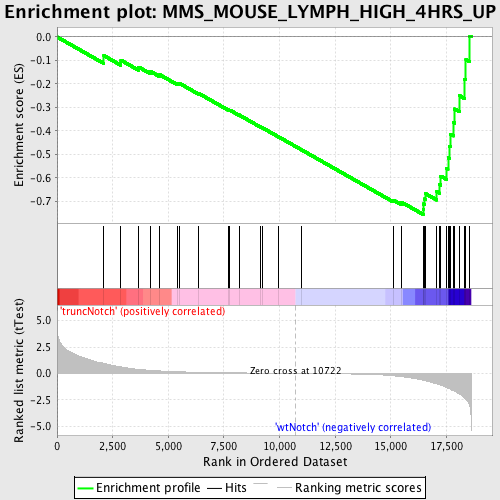
Profile of the Running ES Score & Positions of GeneSet Members on the Rank Ordered List
| Dataset | Set_03_truncNotch_versus_wtNotch.phenotype_truncNotch_versus_wtNotch.cls #truncNotch_versus_wtNotch |
| Phenotype | phenotype_truncNotch_versus_wtNotch.cls#truncNotch_versus_wtNotch |
| Upregulated in class | wtNotch |
| GeneSet | MMS_MOUSE_LYMPH_HIGH_4HRS_UP |
| Enrichment Score (ES) | -0.7563728 |
| Normalized Enrichment Score (NES) | -1.8487495 |
| Nominal p-value | 0.0 |
| FDR q-value | 0.10058467 |
| FWER p-Value | 0.082 |
| PROBE | DESCRIPTION (from dataset) | GENE SYMBOL | GENE_TITLE | RANK IN GENE LIST | RANK METRIC SCORE | RUNNING ES | CORE ENRICHMENT | |
|---|---|---|---|---|---|---|---|---|
| 1 | HNRPDL | 1050102 1090181 5360471 | 2100 | 0.946 | -0.0794 | No | ||
| 2 | EIF4A2 | 1170494 1740711 2850504 | 2866 | 0.611 | -0.0989 | No | ||
| 3 | EIF1AY | 1230541 6130301 | 3661 | 0.383 | -0.1281 | No | ||
| 4 | CYB5A | 5080450 | 4194 | 0.285 | -0.1466 | No | ||
| 5 | PLK4 | 430162 5720110 | 4615 | 0.232 | -0.1610 | No | ||
| 6 | NQO1 | 3450136 6840121 | 5414 | 0.156 | -0.1984 | No | ||
| 7 | ACTG1 | 540215 | 5501 | 0.151 | -0.1977 | No | ||
| 8 | LMO4 | 3800746 | 6356 | 0.101 | -0.2400 | No | ||
| 9 | LYPLA1 | 4480373 5570551 | 7693 | 0.056 | -0.3099 | No | ||
| 10 | RAB18 | 3120575 4590577 | 7758 | 0.055 | -0.3114 | No | ||
| 11 | PSMA3 | 5900047 7040161 | 8176 | 0.045 | -0.3322 | No | ||
| 12 | PTDSS1 | 6020215 | 9149 | 0.026 | -0.3836 | No | ||
| 13 | RCN2 | 840324 | 9218 | 0.025 | -0.3864 | No | ||
| 14 | HMGB3 | 2940168 | 9968 | 0.012 | -0.4263 | No | ||
| 15 | SP3 | 3840338 | 10973 | -0.004 | -0.4801 | No | ||
| 16 | VPS4B | 3440332 | 15118 | -0.225 | -0.6952 | No | ||
| 17 | FEN1 | 1770541 | 15480 | -0.302 | -0.7039 | No | ||
| 18 | CDC6 | 4570296 5360600 | 16457 | -0.641 | -0.7336 | Yes | ||
| 19 | RBBP6 | 2320129 | 16474 | -0.650 | -0.7114 | Yes | ||
| 20 | MARK2 | 7210608 | 16526 | -0.675 | -0.6902 | Yes | ||
| 21 | CXCR4 | 4590519 | 16552 | -0.686 | -0.6672 | Yes | ||
| 22 | GAS5 | 1980136 4210551 | 17066 | -0.998 | -0.6595 | Yes | ||
| 23 | RRM2 | 6350059 6940162 | 17182 | -1.046 | -0.6285 | Yes | ||
| 24 | TXNRD1 | 6590446 | 17245 | -1.098 | -0.5929 | Yes | ||
| 25 | ATP6V1A | 6590242 | 17513 | -1.330 | -0.5601 | Yes | ||
| 26 | CCRN4L | 50438 5130372 | 17571 | -1.389 | -0.5139 | Yes | ||
| 27 | PGRMC1 | 4150692 | 17635 | -1.451 | -0.4658 | Yes | ||
| 28 | XBP1 | 3840594 | 17677 | -1.491 | -0.4151 | Yes | ||
| 29 | VBP1 | 4070050 | 17806 | -1.639 | -0.3639 | Yes | ||
| 30 | RBBP7 | 430113 450450 2370309 | 17868 | -1.701 | -0.3068 | Yes | ||
| 31 | UBE1C | 6040341 | 18083 | -1.931 | -0.2499 | Yes | ||
| 32 | PELI1 | 3870215 6900040 | 18317 | -2.326 | -0.1799 | Yes | ||
| 33 | DCK | 6900411 | 18375 | -2.451 | -0.0960 | Yes | ||
| 34 | PRKAR1A | 3450369 | 18550 | -3.071 | 0.0036 | Yes |

