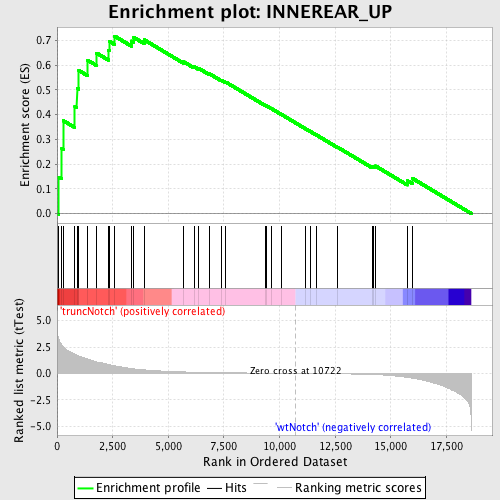
Profile of the Running ES Score & Positions of GeneSet Members on the Rank Ordered List
| Dataset | Set_03_truncNotch_versus_wtNotch.phenotype_truncNotch_versus_wtNotch.cls #truncNotch_versus_wtNotch |
| Phenotype | phenotype_truncNotch_versus_wtNotch.cls#truncNotch_versus_wtNotch |
| Upregulated in class | truncNotch |
| GeneSet | INNEREAR_UP |
| Enrichment Score (ES) | 0.7179628 |
| Normalized Enrichment Score (NES) | 1.6758988 |
| Nominal p-value | 0.0 |
| FDR q-value | 0.11503861 |
| FWER p-Value | 0.611 |
| PROBE | DESCRIPTION (from dataset) | GENE SYMBOL | GENE_TITLE | RANK IN GENE LIST | RANK METRIC SCORE | RUNNING ES | CORE ENRICHMENT | |
|---|---|---|---|---|---|---|---|---|
| 1 | DGCR6 | 5890129 | 70 | 3.258 | 0.1475 | Yes | ||
| 2 | CLU | 5420075 | 211 | 2.667 | 0.2638 | Yes | ||
| 3 | S100A13 | 520019 | 278 | 2.492 | 0.3760 | Yes | ||
| 4 | VAMP5 | 3830300 | 799 | 1.817 | 0.4324 | Yes | ||
| 5 | USP11 | 6370408 6520193 | 893 | 1.720 | 0.5072 | Yes | ||
| 6 | MGP | 6900736 | 974 | 1.640 | 0.5791 | Yes | ||
| 7 | RPS15 | 580100 | 1375 | 1.353 | 0.6204 | Yes | ||
| 8 | RBP1 | 1690072 | 1773 | 1.088 | 0.6495 | Yes | ||
| 9 | APOD | 4920441 | 2308 | 0.850 | 0.6602 | Yes | ||
| 10 | IGFBP6 | 1580181 | 2344 | 0.834 | 0.6971 | Yes | ||
| 11 | SELM | 450458 | 2585 | 0.728 | 0.7180 | Yes | ||
| 12 | LRP1 | 6270386 | 3343 | 0.453 | 0.6983 | No | ||
| 13 | RPL35 | 6940070 | 3441 | 0.429 | 0.7130 | No | ||
| 14 | PTGDS | 3610519 | 3915 | 0.335 | 0.7031 | No | ||
| 15 | COCH | 1090136 | 5694 | 0.138 | 0.6138 | No | ||
| 16 | COL9A1 | 4570369 7100446 | 6152 | 0.111 | 0.5943 | No | ||
| 17 | PLEKHB1 | 3120039 4050270 540546 870463 | 6346 | 0.102 | 0.5887 | No | ||
| 18 | COL9A3 | 4050541 | 6845 | 0.082 | 0.5657 | No | ||
| 19 | LHFP | 3440368 | 7383 | 0.065 | 0.5398 | No | ||
| 20 | ISLR | 110273 6450368 | 7588 | 0.060 | 0.5316 | No | ||
| 21 | UTY | 5890441 | 9367 | 0.022 | 0.4370 | No | ||
| 22 | CRYM | 3940528 | 9429 | 0.021 | 0.4347 | No | ||
| 23 | OTOR | 3440010 | 9632 | 0.018 | 0.4247 | No | ||
| 24 | CCS | 3450524 | 10089 | 0.010 | 0.4006 | No | ||
| 25 | FOXD1 | 6860053 | 11159 | -0.007 | 0.3434 | No | ||
| 26 | FBXO2 | 6510091 | 11370 | -0.010 | 0.3326 | No | ||
| 27 | ZP2 | 1580408 | 11637 | -0.015 | 0.3190 | No | ||
| 28 | RPL28 | 6900136 | 12605 | -0.036 | 0.2687 | No | ||
| 29 | DDR2 | 7050273 | 14158 | -0.105 | 0.1900 | No | ||
| 30 | USH1C | 1570372 4230364 | 14222 | -0.110 | 0.1918 | No | ||
| 31 | UBA52 | 6180288 | 14310 | -0.118 | 0.1926 | No | ||
| 32 | RPS5 | 580093 | 15743 | -0.382 | 0.1332 | No | ||
| 33 | RPS11 | 4120403 | 15976 | -0.459 | 0.1421 | No |

