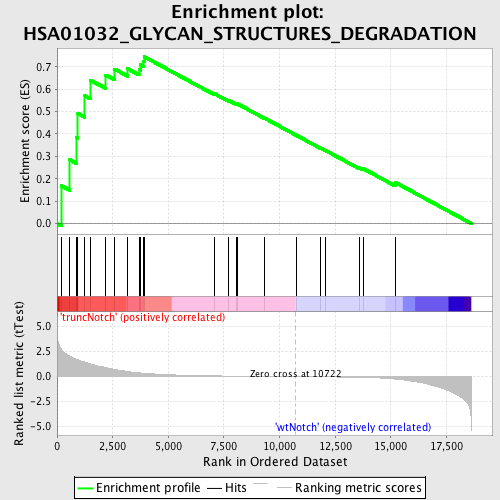
Profile of the Running ES Score & Positions of GeneSet Members on the Rank Ordered List
| Dataset | Set_03_truncNotch_versus_wtNotch.phenotype_truncNotch_versus_wtNotch.cls #truncNotch_versus_wtNotch |
| Phenotype | phenotype_truncNotch_versus_wtNotch.cls#truncNotch_versus_wtNotch |
| Upregulated in class | truncNotch |
| GeneSet | HSA01032_GLYCAN_STRUCTURES_DEGRADATION |
| Enrichment Score (ES) | 0.7443019 |
| Normalized Enrichment Score (NES) | 1.6289641 |
| Nominal p-value | 0.003407155 |
| FDR q-value | 0.15400453 |
| FWER p-Value | 0.895 |
| PROBE | DESCRIPTION (from dataset) | GENE SYMBOL | GENE_TITLE | RANK IN GENE LIST | RANK METRIC SCORE | RUNNING ES | CORE ENRICHMENT | |
|---|---|---|---|---|---|---|---|---|
| 1 | MAN2C1 | 6770064 | 202 | 2.713 | 0.1682 | Yes | ||
| 2 | NEU3 | 3710270 | 560 | 2.064 | 0.2852 | Yes | ||
| 3 | MAN2B2 | 3120706 | 858 | 1.747 | 0.3846 | Yes | ||
| 4 | GALNS | 1850537 | 933 | 1.689 | 0.4921 | Yes | ||
| 5 | NEU1 | 380546 | 1248 | 1.439 | 0.5702 | Yes | ||
| 6 | NAGLU | 610095 | 1502 | 1.266 | 0.6401 | Yes | ||
| 7 | HEXA | 2630358 | 2190 | 0.905 | 0.6629 | Yes | ||
| 8 | GNS | 3120458 | 2588 | 0.726 | 0.6895 | Yes | ||
| 9 | HYAL2 | 1500152 | 3170 | 0.502 | 0.6914 | Yes | ||
| 10 | ARSB | 3190093 5360491 | 3685 | 0.377 | 0.6886 | Yes | ||
| 11 | MAN2B1 | 4210446 | 3755 | 0.362 | 0.7088 | Yes | ||
| 12 | GLB1 | 6840673 | 3877 | 0.343 | 0.7250 | Yes | ||
| 13 | GBA | 2640301 | 3927 | 0.333 | 0.7443 | Yes | ||
| 14 | AGA | 6350292 | 7079 | 0.074 | 0.5797 | No | ||
| 15 | IDS | 360619 5720161 | 7699 | 0.056 | 0.5501 | No | ||
| 16 | NEU2 | 6510711 | 8043 | 0.048 | 0.5349 | No | ||
| 17 | FUCA1 | 610075 | 8096 | 0.047 | 0.5352 | No | ||
| 18 | NEU4 | 430593 510113 2450279 | 9332 | 0.023 | 0.4703 | No | ||
| 19 | HEXB | 5860692 | 10779 | -0.001 | 0.3926 | No | ||
| 20 | SPAM1 | 4480398 | 11826 | -0.019 | 0.3376 | No | ||
| 21 | HYAL1 | 3850341 | 12050 | -0.024 | 0.3271 | No | ||
| 22 | IDUA | 2690131 4060541 | 13600 | -0.072 | 0.2486 | No | ||
| 23 | MANBA | 3990537 | 13755 | -0.080 | 0.2455 | No | ||
| 24 | HPSE | 6660021 | 15191 | -0.240 | 0.1842 | No |

