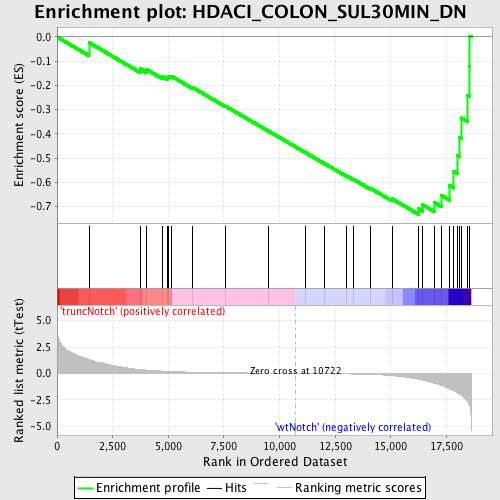
Profile of the Running ES Score & Positions of GeneSet Members on the Rank Ordered List
| Dataset | Set_03_truncNotch_versus_wtNotch.phenotype_truncNotch_versus_wtNotch.cls #truncNotch_versus_wtNotch |
| Phenotype | phenotype_truncNotch_versus_wtNotch.cls#truncNotch_versus_wtNotch |
| Upregulated in class | wtNotch |
| GeneSet | HDACI_COLON_SUL30MIN_DN |
| Enrichment Score (ES) | -0.7332877 |
| Normalized Enrichment Score (NES) | -1.77878 |
| Nominal p-value | 0.0025974025 |
| FDR q-value | 0.03508636 |
| FWER p-Value | 0.274 |
| PROBE | DESCRIPTION (from dataset) | GENE SYMBOL | GENE_TITLE | RANK IN GENE LIST | RANK METRIC SCORE | RUNNING ES | CORE ENRICHMENT | |
|---|---|---|---|---|---|---|---|---|
| 1 | STK11IP | 6980735 | 1434 | 1.321 | -0.0230 | No | ||
| 2 | SLC9A9 | 1940309 | 3734 | 0.366 | -0.1317 | No | ||
| 3 | GOLGB1 | 4730458 7050309 | 4015 | 0.317 | -0.1338 | No | ||
| 4 | THRAP3 | 6180309 | 4753 | 0.216 | -0.1646 | No | ||
| 5 | AASS | 360215 630463 1400368 | 4949 | 0.196 | -0.1670 | No | ||
| 6 | DLG1 | 2630091 6020286 | 5006 | 0.191 | -0.1622 | No | ||
| 7 | PHLDA1 | 2450020 | 5133 | 0.179 | -0.1617 | No | ||
| 8 | PPP2R2A | 2900014 5700575 | 6075 | 0.115 | -0.2076 | No | ||
| 9 | BIRC6 | 70148 | 7578 | 0.060 | -0.2859 | No | ||
| 10 | MME | 6040673 | 9488 | 0.020 | -0.3878 | No | ||
| 11 | PTPRN | 5900577 | 11168 | -0.007 | -0.4778 | No | ||
| 12 | SSR1 | 5890100 | 12032 | -0.023 | -0.5233 | No | ||
| 13 | SNTB1 | 730450 2680632 | 13015 | -0.049 | -0.5741 | No | ||
| 14 | NBN | 730538 2470619 4780594 | 13322 | -0.060 | -0.5881 | No | ||
| 15 | ITGA6 | 3830129 | 14095 | -0.100 | -0.6255 | No | ||
| 16 | TTC3 | 1170746 3290014 4060121 4120731 4570670 5220253 5290129 5670288 6840079 | 15057 | -0.211 | -0.6686 | No | ||
| 17 | XPO7 | 2630215 6760014 | 16261 | -0.560 | -0.7103 | Yes | ||
| 18 | MGA | 70433 6900064 | 16436 | -0.633 | -0.6938 | Yes | ||
| 19 | TGOLN2 | 4920433 | 16963 | -0.938 | -0.6837 | Yes | ||
| 20 | IDE | 670746 | 17288 | -1.132 | -0.6548 | Yes | ||
| 21 | TXNDC1 | 520398 | 17644 | -1.457 | -0.6142 | Yes | ||
| 22 | MTBP | 50193 3290735 | 17827 | -1.663 | -0.5559 | Yes | ||
| 23 | AMMECR1 | 3800435 | 18003 | -1.846 | -0.4897 | Yes | ||
| 24 | GPIAP1 | 780551 6420079 | 18087 | -1.937 | -0.4148 | Yes | ||
| 25 | MBNL2 | 3450707 | 18177 | -2.076 | -0.3346 | Yes | ||
| 26 | ATP2A2 | 1090075 3990279 | 18452 | -2.633 | -0.2415 | Yes | ||
| 27 | HP1BP3 | 2650575 | 18543 | -3.039 | -0.1219 | Yes | ||
| 28 | PRKAR1A | 3450369 | 18550 | -3.071 | 0.0036 | Yes |

