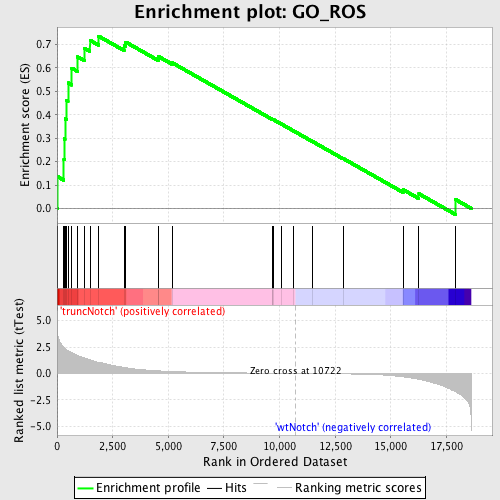
Profile of the Running ES Score & Positions of GeneSet Members on the Rank Ordered List
| Dataset | Set_03_truncNotch_versus_wtNotch.phenotype_truncNotch_versus_wtNotch.cls #truncNotch_versus_wtNotch |
| Phenotype | phenotype_truncNotch_versus_wtNotch.cls#truncNotch_versus_wtNotch |
| Upregulated in class | truncNotch |
| GeneSet | GO_ROS |
| Enrichment Score (ES) | 0.735611 |
| Normalized Enrichment Score (NES) | 1.6439992 |
| Nominal p-value | 0.0016666667 |
| FDR q-value | 0.15480761 |
| FWER p-Value | 0.824 |
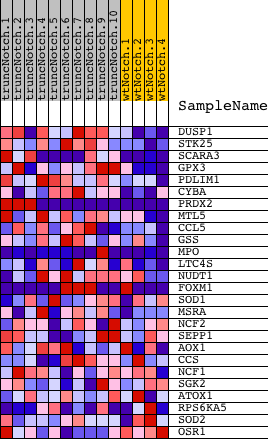
| PROBE | DESCRIPTION (from dataset) | GENE SYMBOL | GENE_TITLE | RANK IN GENE LIST | RANK METRIC SCORE | RUNNING ES | CORE ENRICHMENT | |
|---|---|---|---|---|---|---|---|---|
| 1 | DUSP1 | 6860121 | 29 | 3.727 | 0.1354 | Yes | ||
| 2 | STK25 | 1090519 1500193 | 305 | 2.438 | 0.2102 | Yes | ||
| 3 | SCARA3 | 5890487 | 327 | 2.403 | 0.2974 | Yes | ||
| 4 | GPX3 | 1340450 | 356 | 2.360 | 0.3827 | Yes | ||
| 5 | PDLIM1 | 450100 | 434 | 2.210 | 0.4598 | Yes | ||
| 6 | CYBA | 4760739 | 491 | 2.152 | 0.5358 | Yes | ||
| 7 | PRDX2 | 6760095 4010619 5340577 | 660 | 1.957 | 0.5987 | Yes | ||
| 8 | MTL5 | 6940300 | 922 | 1.694 | 0.6470 | Yes | ||
| 9 | CCL5 | 3710397 | 1229 | 1.453 | 0.6839 | Yes | ||
| 10 | GSS | 6130465 6900398 | 1478 | 1.284 | 0.7178 | Yes | ||
| 11 | MPO | 2360176 2760440 5690176 | 1862 | 1.045 | 0.7356 | Yes | ||
| 12 | LTC4S | 2570411 | 3013 | 0.561 | 0.6944 | No | ||
| 13 | NUDT1 | 2850600 | 3082 | 0.534 | 0.7103 | No | ||
| 14 | FOXM1 | 6650402 6980091 | 4550 | 0.238 | 0.6402 | No | ||
| 15 | SOD1 | 5890070 | 4554 | 0.237 | 0.6487 | No | ||
| 16 | MSRA | 4570411 | 5182 | 0.175 | 0.6214 | No | ||
| 17 | NCF2 | 540129 2370441 2650133 | 9688 | 0.017 | 0.3797 | No | ||
| 18 | SEPP1 | 450273 | 9702 | 0.017 | 0.3796 | No | ||
| 19 | AOX1 | 110082 6290450 | 9714 | 0.016 | 0.3797 | No | ||
| 20 | CCS | 3450524 | 10089 | 0.010 | 0.3599 | No | ||
| 21 | NCF1 | 3850091 | 10615 | 0.002 | 0.3317 | No | ||
| 22 | SGK2 | 1850070 | 11460 | -0.012 | 0.2868 | No | ||
| 23 | ATOX1 | 1090497 | 12851 | -0.043 | 0.2136 | No | ||
| 24 | RPS6KA5 | 2120563 7040546 | 15553 | -0.322 | 0.0802 | No | ||
| 25 | SOD2 | 1410053 | 16262 | -0.560 | 0.0627 | No | ||
| 26 | OSR1 | 1500025 | 17906 | -1.738 | 0.0382 | No |