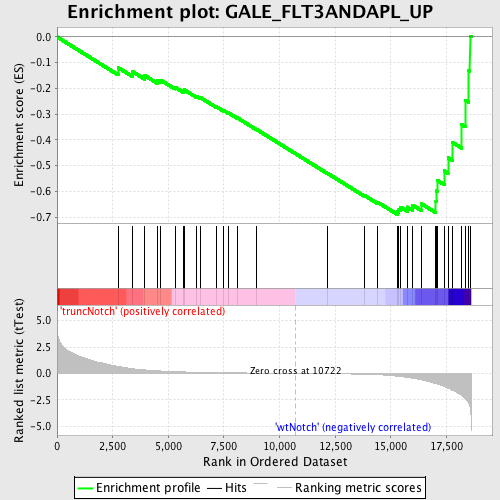
Profile of the Running ES Score & Positions of GeneSet Members on the Rank Ordered List
| Dataset | Set_03_truncNotch_versus_wtNotch.phenotype_truncNotch_versus_wtNotch.cls #truncNotch_versus_wtNotch |
| Phenotype | phenotype_truncNotch_versus_wtNotch.cls#truncNotch_versus_wtNotch |
| Upregulated in class | wtNotch |
| GeneSet | GALE_FLT3ANDAPL_UP |
| Enrichment Score (ES) | -0.6898777 |
| Normalized Enrichment Score (NES) | -1.7191453 |
| Nominal p-value | 0.0 |
| FDR q-value | 0.055591032 |
| FWER p-Value | 0.608 |
| PROBE | DESCRIPTION (from dataset) | GENE SYMBOL | GENE_TITLE | RANK IN GENE LIST | RANK METRIC SCORE | RUNNING ES | CORE ENRICHMENT | |
|---|---|---|---|---|---|---|---|---|
| 1 | RNF144 | 4210332 | 2744 | 0.653 | -0.1192 | No | ||
| 2 | RRAS2 | 6290170 | 3393 | 0.440 | -0.1349 | No | ||
| 3 | PHF11 | 630025 1170358 | 3938 | 0.331 | -0.1498 | No | ||
| 4 | PLAGL1 | 3190082 6200193 | 4502 | 0.243 | -0.1695 | No | ||
| 5 | INPP5F | 60010 5360164 | 4651 | 0.228 | -0.1675 | No | ||
| 6 | LANCL1 | 1770079 6420670 | 5299 | 0.166 | -0.1951 | No | ||
| 7 | PMM2 | 670673 2570044 2690093 4540068 6450056 | 5696 | 0.137 | -0.2105 | No | ||
| 8 | STX16 | 70315 | 5708 | 0.136 | -0.2051 | No | ||
| 9 | AHI1 | 460520 | 6252 | 0.107 | -0.2297 | No | ||
| 10 | MYO1B | 770372 | 6464 | 0.097 | -0.2368 | No | ||
| 11 | RFC3 | 1980600 | 7145 | 0.072 | -0.2703 | No | ||
| 12 | GIMAP6 | 2470014 | 7490 | 0.062 | -0.2861 | No | ||
| 13 | LYPLA1 | 4480373 5570551 | 7693 | 0.056 | -0.2945 | No | ||
| 14 | ABCC1 | 4760722 6770280 | 8086 | 0.047 | -0.3136 | No | ||
| 15 | CSNK1A1 | 2340427 | 8940 | 0.030 | -0.3582 | No | ||
| 16 | TTK | 3800129 | 12149 | -0.026 | -0.5297 | No | ||
| 17 | PIGB | 2850193 6380286 | 13804 | -0.082 | -0.6151 | No | ||
| 18 | LARS2 | 7000706 | 14408 | -0.127 | -0.6420 | No | ||
| 19 | PSMF1 | 5340056 | 15298 | -0.262 | -0.6785 | Yes | ||
| 20 | CHD9 | 430037 2570129 5420398 | 15363 | -0.277 | -0.6699 | Yes | ||
| 21 | SLC25A13 | 4920072 5690722 | 15446 | -0.293 | -0.6615 | Yes | ||
| 22 | NOLC1 | 2350195 | 15741 | -0.381 | -0.6608 | Yes | ||
| 23 | SOCS2 | 4760692 | 15983 | -0.461 | -0.6536 | Yes | ||
| 24 | TCF12 | 3610324 7000156 | 16383 | -0.608 | -0.6486 | Yes | ||
| 25 | CDC16 | 1940706 | 17027 | -0.980 | -0.6406 | Yes | ||
| 26 | HNRPH1 | 1170086 3140546 3290471 6110184 6110373 | 17039 | -0.983 | -0.5983 | Yes | ||
| 27 | GEMIN4 | 130278 2230075 | 17092 | -1.003 | -0.5575 | Yes | ||
| 28 | HTATIP2 | 3120465 | 17405 | -1.234 | -0.5205 | Yes | ||
| 29 | UPF3A | 2360333 5340008 | 17574 | -1.390 | -0.4691 | Yes | ||
| 30 | ATR | 6860273 | 17772 | -1.606 | -0.4097 | Yes | ||
| 31 | DHX15 | 870632 | 18188 | -2.087 | -0.3412 | Yes | ||
| 32 | MTMR1 | 1660131 | 18341 | -2.375 | -0.2460 | Yes | ||
| 33 | KPNB1 | 1690138 | 18506 | -2.828 | -0.1316 | Yes | ||
| 34 | VPS54 | 1660168 | 18558 | -3.158 | 0.0031 | Yes |

