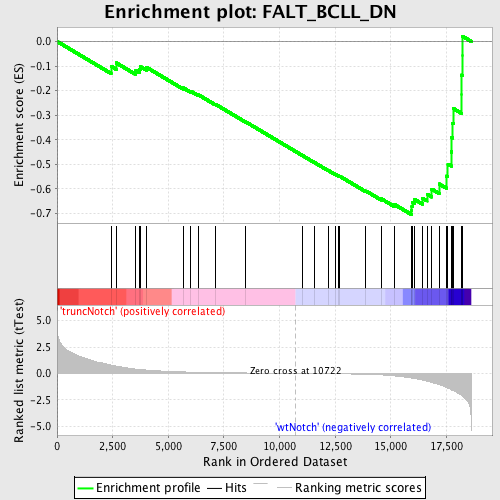
Profile of the Running ES Score & Positions of GeneSet Members on the Rank Ordered List
| Dataset | Set_03_truncNotch_versus_wtNotch.phenotype_truncNotch_versus_wtNotch.cls #truncNotch_versus_wtNotch |
| Phenotype | phenotype_truncNotch_versus_wtNotch.cls#truncNotch_versus_wtNotch |
| Upregulated in class | wtNotch |
| GeneSet | FALT_BCLL_DN |
| Enrichment Score (ES) | -0.7043266 |
| Normalized Enrichment Score (NES) | -1.8054538 |
| Nominal p-value | 0.0 |
| FDR q-value | 0.07974345 |
| FWER p-Value | 0.179 |
| PROBE | DESCRIPTION (from dataset) | GENE SYMBOL | GENE_TITLE | RANK IN GENE LIST | RANK METRIC SCORE | RUNNING ES | CORE ENRICHMENT | |
|---|---|---|---|---|---|---|---|---|
| 1 | SCRN1 | 6040025 6580019 | 2428 | 0.791 | -0.1010 | No | ||
| 2 | COX7A2 | 4280114 | 2657 | 0.694 | -0.0872 | No | ||
| 3 | FCGR2B | 780750 | 3535 | 0.410 | -0.1190 | No | ||
| 4 | MKRN1 | 1410097 | 3699 | 0.374 | -0.1137 | No | ||
| 5 | MXI1 | 5050064 5130484 | 3745 | 0.363 | -0.1025 | No | ||
| 6 | TBCC | 4810021 | 4028 | 0.315 | -0.1058 | No | ||
| 7 | PLP2 | 2100167 | 5671 | 0.138 | -0.1890 | No | ||
| 8 | RABGAP1L | 3190014 6860088 | 5996 | 0.120 | -0.2019 | No | ||
| 9 | LMO4 | 3800746 | 6356 | 0.101 | -0.2175 | No | ||
| 10 | RNF13 | 2370021 | 7098 | 0.073 | -0.2546 | No | ||
| 11 | ADARB1 | 780451 | 8481 | 0.039 | -0.3275 | No | ||
| 12 | PSMD8 | 630142 | 11013 | -0.005 | -0.4636 | No | ||
| 13 | CTDSP2 | 5340315 5690133 | 11559 | -0.014 | -0.4924 | No | ||
| 14 | HEBP2 | 1990309 | 12203 | -0.027 | -0.5260 | No | ||
| 15 | PLCL2 | 6100575 | 12494 | -0.034 | -0.5403 | No | ||
| 16 | SPEN | 2060041 | 12625 | -0.037 | -0.5459 | No | ||
| 17 | MOAP1 | 580537 | 12711 | -0.039 | -0.5490 | No | ||
| 18 | PBX3 | 1300424 3710577 6180575 | 13879 | -0.086 | -0.6086 | No | ||
| 19 | CDKN1B | 3800025 6450044 | 14572 | -0.142 | -0.6405 | No | ||
| 20 | SAP18 | 3610092 | 15158 | -0.232 | -0.6633 | No | ||
| 21 | SNW1 | 4010736 | 15922 | -0.442 | -0.6877 | Yes | ||
| 22 | ASAH1 | 510152 1340484 1740707 | 15947 | -0.450 | -0.6721 | Yes | ||
| 23 | NDUFC1 | 2570377 4200239 | 15967 | -0.457 | -0.6560 | Yes | ||
| 24 | TSPO | 110692 3390452 | 16065 | -0.488 | -0.6429 | Yes | ||
| 25 | PUM1 | 6130500 | 16425 | -0.627 | -0.6386 | Yes | ||
| 26 | CCNG2 | 3190095 | 16627 | -0.734 | -0.6219 | Yes | ||
| 27 | TBL1X | 6400524 | 16839 | -0.858 | -0.6011 | Yes | ||
| 28 | CBX7 | 3940035 | 17175 | -1.042 | -0.5800 | Yes | ||
| 29 | MAP3K7IP2 | 2340242 | 17493 | -1.315 | -0.5476 | Yes | ||
| 30 | ING1 | 5690010 6520056 | 17568 | -1.388 | -0.4995 | Yes | ||
| 31 | NPC2 | 2350102 | 17717 | -1.546 | -0.4494 | Yes | ||
| 32 | ACBD3 | 2760170 | 17738 | -1.570 | -0.3915 | Yes | ||
| 33 | PSMD10 | 520494 1170576 3830050 | 17774 | -1.611 | -0.3328 | Yes | ||
| 34 | SMAD2 | 4200592 | 17810 | -1.643 | -0.2730 | Yes | ||
| 35 | SMC5 | 3440164 | 18179 | -2.080 | -0.2147 | Yes | ||
| 36 | DDX1 | 3450047 | 18181 | -2.082 | -0.1365 | Yes | ||
| 37 | POP4 | 4560600 | 18210 | -2.122 | -0.0583 | Yes | ||
| 38 | YWHAB | 1740176 | 18212 | -2.133 | 0.0217 | Yes |

