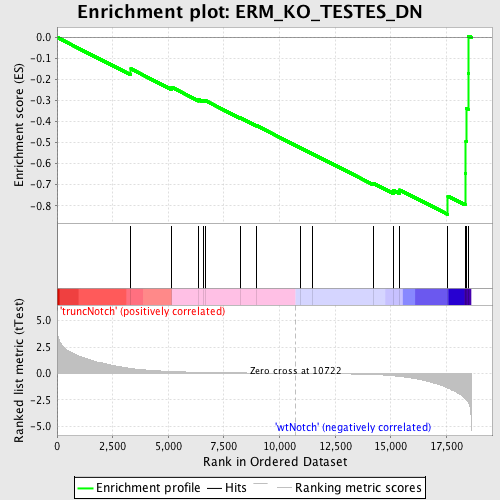
Profile of the Running ES Score & Positions of GeneSet Members on the Rank Ordered List
| Dataset | Set_03_truncNotch_versus_wtNotch.phenotype_truncNotch_versus_wtNotch.cls #truncNotch_versus_wtNotch |
| Phenotype | phenotype_truncNotch_versus_wtNotch.cls#truncNotch_versus_wtNotch |
| Upregulated in class | wtNotch |
| GeneSet | ERM_KO_TESTES_DN |
| Enrichment Score (ES) | -0.84164727 |
| Normalized Enrichment Score (NES) | -1.8308247 |
| Nominal p-value | 0.0023696683 |
| FDR q-value | 0.06770595 |
| FWER p-Value | 0.106 |
| PROBE | DESCRIPTION (from dataset) | GENE SYMBOL | GENE_TITLE | RANK IN GENE LIST | RANK METRIC SCORE | RUNNING ES | CORE ENRICHMENT | |
|---|---|---|---|---|---|---|---|---|
| 1 | MCM2 | 5050139 | 3319 | 0.459 | -0.1496 | No | ||
| 2 | RBMY1A1 | 6200053 | 5156 | 0.177 | -0.2371 | No | ||
| 3 | SOX3 | 4570537 | 6370 | 0.101 | -0.2960 | No | ||
| 4 | DMC1 | 450341 | 6562 | 0.092 | -0.3005 | No | ||
| 5 | TKTL1 | 2810672 6760102 | 6673 | 0.088 | -0.3008 | No | ||
| 6 | CRABP1 | 450278 | 8222 | 0.044 | -0.3813 | No | ||
| 7 | HELLS | 4560086 4810025 | 8968 | 0.029 | -0.4195 | No | ||
| 8 | DAZL | 4050082 | 10934 | -0.004 | -0.5249 | No | ||
| 9 | DDX10 | 520746 | 11486 | -0.013 | -0.5538 | No | ||
| 10 | TGFBR1 | 1400148 4280020 6550711 | 14213 | -0.109 | -0.6935 | No | ||
| 11 | RAD51 | 6110450 6980280 | 15117 | -0.225 | -0.7279 | No | ||
| 12 | CDK2 | 130484 2260301 4010088 5050110 | 15400 | -0.284 | -0.7252 | No | ||
| 13 | CCNE2 | 3120537 | 17567 | -1.388 | -0.7544 | Yes | ||
| 14 | MAD2L1 | 4480725 | 18343 | -2.379 | -0.6464 | Yes | ||
| 15 | DCK | 6900411 | 18375 | -2.451 | -0.4938 | Yes | ||
| 16 | RBL1 | 3130372 | 18396 | -2.502 | -0.3375 | Yes | ||
| 17 | NFYB | 1850053 | 18478 | -2.739 | -0.1695 | Yes | ||
| 18 | CDCA7 | 3060097 | 18500 | -2.812 | 0.0062 | Yes |

