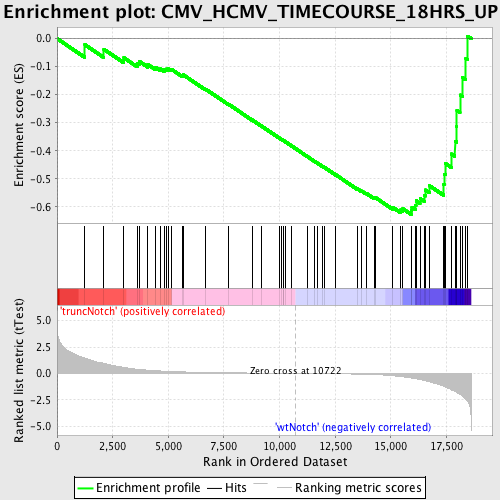
Profile of the Running ES Score & Positions of GeneSet Members on the Rank Ordered List
| Dataset | Set_03_truncNotch_versus_wtNotch.phenotype_truncNotch_versus_wtNotch.cls #truncNotch_versus_wtNotch |
| Phenotype | phenotype_truncNotch_versus_wtNotch.cls#truncNotch_versus_wtNotch |
| Upregulated in class | wtNotch |
| GeneSet | CMV_HCMV_TIMECOURSE_18HRS_UP |
| Enrichment Score (ES) | -0.6274245 |
| Normalized Enrichment Score (NES) | -1.720114 |
| Nominal p-value | 0.0 |
| FDR q-value | 0.0577668 |
| FWER p-Value | 0.605 |
| PROBE | DESCRIPTION (from dataset) | GENE SYMBOL | GENE_TITLE | RANK IN GENE LIST | RANK METRIC SCORE | RUNNING ES | CORE ENRICHMENT | |
|---|---|---|---|---|---|---|---|---|
| 1 | NEU1 | 380546 | 1248 | 1.439 | -0.0218 | No | ||
| 2 | SON | 3120148 5860239 7040403 | 2102 | 0.945 | -0.0380 | No | ||
| 3 | ARHGEF5 | 3170605 | 3002 | 0.566 | -0.0686 | No | ||
| 4 | DMN | 4060673 4570152 7050692 | 3601 | 0.396 | -0.0883 | No | ||
| 5 | DYNC1I1 | 1410605 | 3688 | 0.376 | -0.0811 | No | ||
| 6 | MAN2A2 | 2640008 5720142 | 4078 | 0.306 | -0.0924 | No | ||
| 7 | PAQR3 | 2480064 | 4434 | 0.254 | -0.1035 | No | ||
| 8 | INPP5F | 60010 5360164 | 4651 | 0.228 | -0.1079 | No | ||
| 9 | SLC12A2 | 4610019 6040672 | 4813 | 0.210 | -0.1100 | No | ||
| 10 | POLE3 | 5270019 | 4900 | 0.201 | -0.1083 | No | ||
| 11 | DLG1 | 2630091 6020286 | 5006 | 0.191 | -0.1079 | No | ||
| 12 | MEF2D | 5690576 | 5131 | 0.180 | -0.1089 | No | ||
| 13 | PDLIM3 | 1410095 | 5646 | 0.140 | -0.1322 | No | ||
| 14 | TESK2 | 6520524 | 5668 | 0.139 | -0.1289 | No | ||
| 15 | BRMS1 | 6860280 | 6664 | 0.089 | -0.1797 | No | ||
| 16 | RNF2 | 2340497 | 7708 | 0.056 | -0.2342 | No | ||
| 17 | SERPINB8 | 4050465 | 8764 | 0.033 | -0.2900 | No | ||
| 18 | RFK | 1050070 | 9179 | 0.026 | -0.3115 | No | ||
| 19 | TBC1D12 | 6130088 | 10005 | 0.012 | -0.3556 | No | ||
| 20 | ISL1 | 4810239 | 10082 | 0.010 | -0.3593 | No | ||
| 21 | RPS6KB1 | 1450427 5080110 6200563 | 10166 | 0.009 | -0.3635 | No | ||
| 22 | TAF5 | 3450288 5890193 6860435 | 10194 | 0.008 | -0.3647 | No | ||
| 23 | STAM2 | 730731 2120377 | 10259 | 0.007 | -0.3679 | No | ||
| 24 | KCNS3 | 4150039 | 10523 | 0.003 | -0.3820 | No | ||
| 25 | STCH | 3990050 | 11258 | -0.009 | -0.4213 | No | ||
| 26 | CRY1 | 6770039 | 11585 | -0.015 | -0.4384 | No | ||
| 27 | DR1 | 5860750 | 11705 | -0.017 | -0.4442 | No | ||
| 28 | GCH1 | 670364 6550358 | 11939 | -0.021 | -0.4561 | No | ||
| 29 | SSR1 | 5890100 | 12032 | -0.023 | -0.4603 | No | ||
| 30 | NUP153 | 7000452 | 12531 | -0.035 | -0.4861 | No | ||
| 31 | GCLC | 2810731 | 13481 | -0.067 | -0.5351 | No | ||
| 32 | HIPK1 | 110193 | 13682 | -0.076 | -0.5435 | No | ||
| 33 | UPF1 | 430164 1190750 | 13888 | -0.087 | -0.5518 | No | ||
| 34 | GATM | 380671 | 14245 | -0.112 | -0.5674 | No | ||
| 35 | OLFM1 | 3360161 5570066 | 14298 | -0.117 | -0.5665 | No | ||
| 36 | TRIM23 | 580168 6510672 | 15095 | -0.219 | -0.6025 | No | ||
| 37 | SLC39A14 | 670300 1400093 1990711 | 15428 | -0.288 | -0.6113 | No | ||
| 38 | PRPF3 | 2510435 2940593 3610113 5390722 | 15542 | -0.320 | -0.6073 | No | ||
| 39 | PDE4D | 2470528 6660014 | 15917 | -0.441 | -0.6135 | Yes | ||
| 40 | PTGER2 | 3170039 | 15948 | -0.450 | -0.6009 | Yes | ||
| 41 | FNBP4 | 1740139 7050113 | 16114 | -0.506 | -0.5938 | Yes | ||
| 42 | RCHY1 | 3800739 | 16134 | -0.512 | -0.5787 | Yes | ||
| 43 | ZBTB1 | 5220010 | 16314 | -0.582 | -0.5700 | Yes | ||
| 44 | CASP2 | 2260692 | 16502 | -0.666 | -0.5591 | Yes | ||
| 45 | CRLF3 | 6620019 | 16549 | -0.685 | -0.5399 | Yes | ||
| 46 | OVGP1 | 2630746 2940372 | 16746 | -0.804 | -0.5251 | Yes | ||
| 47 | ANGEL2 | 3780240 | 17382 | -1.216 | -0.5209 | Yes | ||
| 48 | PPAT | 1980019 | 17400 | -1.230 | -0.4830 | Yes | ||
| 49 | PPM1A | 1170301 5900273 | 17459 | -1.275 | -0.4459 | Yes | ||
| 50 | CHD1 | 4590048 | 17736 | -1.565 | -0.4114 | Yes | ||
| 51 | CCNC | 3390750 | 17884 | -1.713 | -0.3653 | Yes | ||
| 52 | UPF2 | 4810471 | 17962 | -1.793 | -0.3129 | Yes | ||
| 53 | AHCTF1 | 7040100 | 17971 | -1.810 | -0.2562 | Yes | ||
| 54 | TAF1A | 2510707 | 18111 | -1.985 | -0.2011 | Yes | ||
| 55 | ATP6V1C1 | 2690324 5220528 | 18222 | -2.150 | -0.1392 | Yes | ||
| 56 | ZBED4 | 770441 | 18373 | -2.450 | -0.0699 | Yes | ||
| 57 | ANP32E | 6510706 | 18450 | -2.630 | 0.0089 | Yes |

