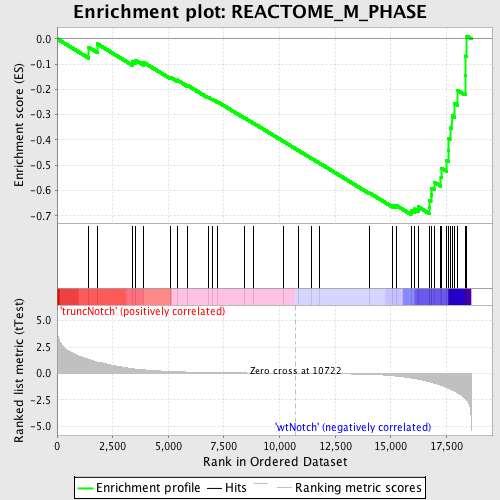
Profile of the Running ES Score & Positions of GeneSet Members on the Rank Ordered List
| Dataset | Set_03_truncNotch_versus_wtNotch.phenotype_truncNotch_versus_wtNotch.cls #truncNotch_versus_wtNotch |
| Phenotype | phenotype_truncNotch_versus_wtNotch.cls#truncNotch_versus_wtNotch |
| Upregulated in class | wtNotch |
| GeneSet | REACTOME_M_PHASE |
| Enrichment Score (ES) | -0.6949482 |
| Normalized Enrichment Score (NES) | -1.7653699 |
| Nominal p-value | 0.0 |
| FDR q-value | 0.18869379 |
| FWER p-Value | 0.233 |
| PROBE | DESCRIPTION (from dataset) | GENE SYMBOL | GENE_TITLE | RANK IN GENE LIST | RANK METRIC SCORE | RUNNING ES | CORE ENRICHMENT | |
|---|---|---|---|---|---|---|---|---|
| 1 | PMF1 | 5130273 | 1425 | 1.325 | -0.0339 | No | ||
| 2 | RANGAP1 | 2320593 6650601 | 1814 | 1.071 | -0.0203 | No | ||
| 3 | BUB3 | 3170546 | 3396 | 0.440 | -0.0912 | No | ||
| 4 | CDC20 | 3440017 3440044 6220088 | 3513 | 0.413 | -0.0841 | No | ||
| 5 | KIF2B | 5700066 | 3886 | 0.341 | -0.0931 | No | ||
| 6 | KIF20A | 2650050 | 5090 | 0.183 | -0.1519 | No | ||
| 7 | PLK1 | 1780369 2640121 | 5389 | 0.159 | -0.1628 | No | ||
| 8 | CENPE | 2850022 | 5869 | 0.126 | -0.1846 | No | ||
| 9 | CLIP1 | 2850162 6770397 | 6789 | 0.084 | -0.2313 | No | ||
| 10 | NUP37 | 2370097 6370435 6380008 | 6973 | 0.077 | -0.2387 | No | ||
| 11 | PAFAH1B1 | 4230333 6420121 6450066 | 7219 | 0.070 | -0.2496 | No | ||
| 12 | SGOL1 | 1980075 5220092 6020711 | 8402 | 0.040 | -0.3119 | No | ||
| 13 | KIF2A | 3990286 6130575 | 8816 | 0.032 | -0.3331 | No | ||
| 14 | BUB1 | 5390270 | 10159 | 0.009 | -0.4051 | No | ||
| 15 | XPO1 | 540707 | 10863 | -0.002 | -0.4429 | No | ||
| 16 | CLASP2 | 2510139 | 11412 | -0.011 | -0.4720 | No | ||
| 17 | CENPC1 | 610273 | 11790 | -0.018 | -0.4917 | No | ||
| 18 | MLF1IP | 3610367 | 14046 | -0.098 | -0.6099 | No | ||
| 19 | CLASP1 | 6860279 | 15087 | -0.218 | -0.6589 | No | ||
| 20 | PPP1CC | 6380300 2510647 | 15240 | -0.251 | -0.6590 | No | ||
| 21 | RANBP2 | 4280338 | 15909 | -0.437 | -0.6808 | Yes | ||
| 22 | STAG2 | 4540132 | 16056 | -0.485 | -0.6730 | Yes | ||
| 23 | SEC13 | 380577 | 16229 | -0.549 | -0.6646 | Yes | ||
| 24 | BIRC5 | 110408 580014 1770632 | 16722 | -0.790 | -0.6656 | Yes | ||
| 25 | CENPA | 5080154 | 16744 | -0.803 | -0.6408 | Yes | ||
| 26 | NUP43 | 3360482 | 16806 | -0.839 | -0.6170 | Yes | ||
| 27 | RAD21 | 1990278 | 16835 | -0.856 | -0.5909 | Yes | ||
| 28 | KNTC1 | 430079 | 16964 | -0.940 | -0.5674 | Yes | ||
| 29 | ZW10 | 2900735 3520687 | 17254 | -1.103 | -0.5473 | Yes | ||
| 30 | SMC1A | 3060600 5700148 5890113 6370154 | 17283 | -1.130 | -0.5124 | Yes | ||
| 31 | CDCA8 | 2340286 6980019 | 17502 | -1.320 | -0.4815 | Yes | ||
| 32 | KIF23 | 5570112 | 17597 | -1.409 | -0.4411 | Yes | ||
| 33 | NUP160 | 1990551 | 17608 | -1.419 | -0.3958 | Yes | ||
| 34 | ZWINT | 6940670 | 17662 | -1.481 | -0.3508 | Yes | ||
| 35 | NDC80 | 4120465 | 17749 | -1.583 | -0.3044 | Yes | ||
| 36 | SGOL2 | 2030338 | 17861 | -1.693 | -0.2557 | Yes | ||
| 37 | MAPRE1 | 3290037 | 17996 | -1.839 | -0.2035 | Yes | ||
| 38 | MAD2L1 | 4480725 | 18343 | -2.379 | -0.1454 | Yes | ||
| 39 | BUB1B | 1450288 | 18355 | -2.413 | -0.0681 | Yes | ||
| 40 | NUP107 | 6380021 | 18420 | -2.542 | 0.0106 | Yes |

