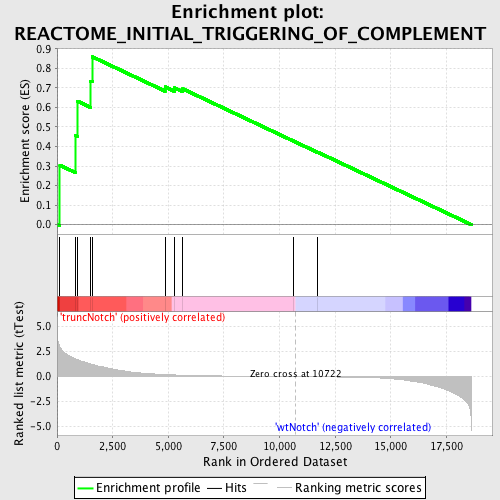
Profile of the Running ES Score & Positions of GeneSet Members on the Rank Ordered List
| Dataset | Set_03_truncNotch_versus_wtNotch.phenotype_truncNotch_versus_wtNotch.cls #truncNotch_versus_wtNotch |
| Phenotype | phenotype_truncNotch_versus_wtNotch.cls#truncNotch_versus_wtNotch |
| Upregulated in class | truncNotch |
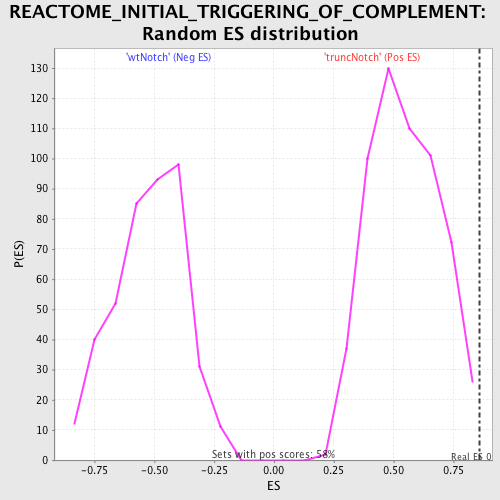
| GeneSet | REACTOME_INITIAL_TRIGGERING_OF_COMPLEMENT |
| Enrichment Score (ES) | 0.8586124 |
| Normalized Enrichment Score (NES) | 1.5727786 |
| Nominal p-value | 0.0034602077 |
| FDR q-value | 0.37063414 |
| FWER p-Value | 0.961 |
| PROBE | DESCRIPTION (from dataset) | GENE SYMBOL | GENE_TITLE | RANK IN GENE LIST | RANK METRIC SCORE | RUNNING ES | CORE ENRICHMENT | |
|---|---|---|---|---|---|---|---|---|
| 1 | C2 | 5390465 | 126 | 2.930 | 0.3038 | Yes | ||
| 2 | C1QC | 5700131 | 815 | 1.798 | 0.4574 | Yes | ||
| 3 | C1QA | 5390687 | 921 | 1.694 | 0.6313 | Yes | ||
| 4 | C3 | 1740372 | 1500 | 1.267 | 0.7345 | Yes | ||
| 5 | C1QB | 5910292 | 1586 | 1.214 | 0.8586 | Yes | ||
| 6 | MASP1 | 1780619 2900066 | 4855 | 0.206 | 0.7049 | No | ||
| 7 | C1R | 2340025 3290152 4850452 | 5280 | 0.167 | 0.6998 | No | ||
| 8 | CFD | 2320736 | 5651 | 0.140 | 0.6947 | No | ||
| 9 | C1S | 840184 6840114 | 10626 | 0.002 | 0.4276 | No | ||
| 10 | MBL2 | 6370446 | 11709 | -0.017 | 0.3712 | No |