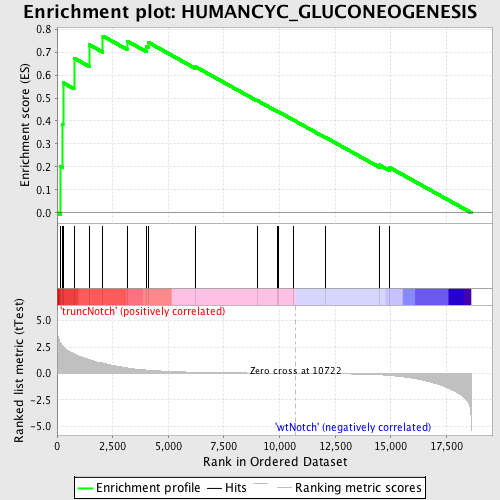
Profile of the Running ES Score & Positions of GeneSet Members on the Rank Ordered List
| Dataset | Set_03_truncNotch_versus_wtNotch.phenotype_truncNotch_versus_wtNotch.cls #truncNotch_versus_wtNotch |
| Phenotype | phenotype_truncNotch_versus_wtNotch.cls#truncNotch_versus_wtNotch |
| Upregulated in class | truncNotch |
| GeneSet | HUMANCYC_GLUCONEOGENESIS |
| Enrichment Score (ES) | 0.7698258 |
| Normalized Enrichment Score (NES) | 1.5534923 |
| Nominal p-value | 0.0123893805 |
| FDR q-value | 0.32689533 |
| FWER p-Value | 0.987 |
| PROBE | DESCRIPTION (from dataset) | GENE SYMBOL | GENE_TITLE | RANK IN GENE LIST | RANK METRIC SCORE | RUNNING ES | CORE ENRICHMENT | |
|---|---|---|---|---|---|---|---|---|
| 1 | ALDOA | 6290672 | 137 | 2.907 | 0.2038 | Yes | ||
| 2 | PGAM2 | 3610605 | 248 | 2.574 | 0.3848 | Yes | ||
| 3 | ENO1 | 5340128 | 266 | 2.516 | 0.5666 | Yes | ||
| 4 | FBP1 | 1470762 | 762 | 1.846 | 0.6740 | Yes | ||
| 5 | PGAM1 | 2570133 | 1449 | 1.311 | 0.7324 | Yes | ||
| 6 | ENO3 | 5270136 | 2060 | 0.967 | 0.7698 | Yes | ||
| 7 | MDH2 | 1850601 | 3147 | 0.511 | 0.7485 | No | ||
| 8 | GAPDHS | 2690463 | 4020 | 0.317 | 0.7247 | No | ||
| 9 | ALDOC | 450121 610427 | 4092 | 0.304 | 0.7429 | No | ||
| 10 | FBP2 | 1580193 | 6205 | 0.109 | 0.6373 | No | ||
| 11 | ALDOB | 4730324 | 8993 | 0.029 | 0.4895 | No | ||
| 12 | PGK2 | 2650091 | 9891 | 0.014 | 0.4423 | No | ||
| 13 | PGK1 | 1570494 630300 | 9928 | 0.013 | 0.4413 | No | ||
| 14 | ME2 | 5080121 | 10606 | 0.002 | 0.4051 | No | ||
| 15 | BPGM | 5080520 | 12049 | -0.024 | 0.3292 | No | ||
| 16 | ENO2 | 2320068 | 14476 | -0.133 | 0.2084 | No | ||
| 17 | MDH1 | 6660358 6760731 | 14950 | -0.194 | 0.1971 | No |

