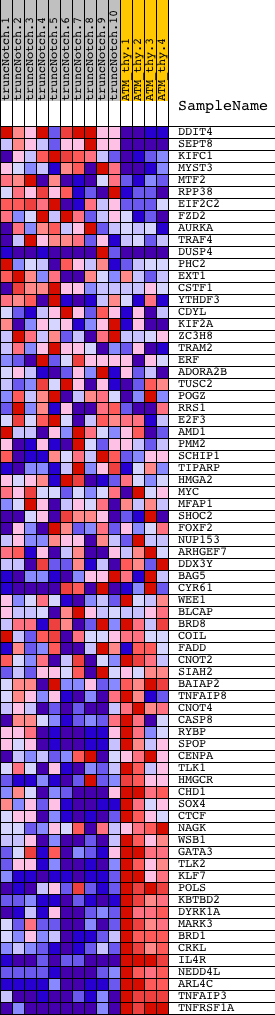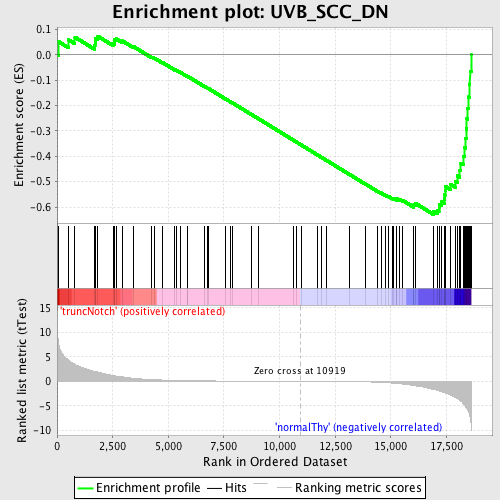
Profile of the Running ES Score & Positions of GeneSet Members on the Rank Ordered List
| Dataset | Set_03_truncNotch_versus_normalThy.phenotype_truncNotch_versus_normalThy.cls #truncNotch_versus_normalThy.phenotype_truncNotch_versus_normalThy.cls #truncNotch_versus_normalThy_repos |
| Phenotype | phenotype_truncNotch_versus_normalThy.cls#truncNotch_versus_normalThy_repos |
| Upregulated in class | normalThy |
| GeneSet | UVB_SCC_DN |
| Enrichment Score (ES) | -0.62940055 |
| Normalized Enrichment Score (NES) | -1.6599927 |
| Nominal p-value | 0.0 |
| FDR q-value | 0.2578018 |
| FWER p-Value | 0.745 |
| PROBE | DESCRIPTION (from dataset) | GENE SYMBOL | GENE_TITLE | RANK IN GENE LIST | RANK METRIC SCORE | RUNNING ES | CORE ENRICHMENT | |
|---|---|---|---|---|---|---|---|---|
| 1 | DDIT4 | 2570408 | 71 | 7.406 | 0.0511 | No | ||
| 2 | SEPT8 | 4610463 | 526 | 4.284 | 0.0584 | No | ||
| 3 | KIFC1 | 2570332 2480725 | 802 | 3.441 | 0.0690 | No | ||
| 4 | MYST3 | 5270500 | 1680 | 2.048 | 0.0369 | No | ||
| 5 | MTF2 | 50333 | 1707 | 2.019 | 0.0505 | No | ||
| 6 | RPP38 | 2450164 | 1737 | 1.988 | 0.0637 | No | ||
| 7 | EIF2C2 | 770451 | 1822 | 1.913 | 0.0733 | No | ||
| 8 | FZD2 | 6480154 | 2520 | 1.186 | 0.0445 | No | ||
| 9 | AURKA | 780537 | 2571 | 1.150 | 0.0504 | No | ||
| 10 | TRAF4 | 3060041 4920528 6980286 | 2579 | 1.145 | 0.0585 | No | ||
| 11 | DUSP4 | 2690044 2850593 | 2653 | 1.086 | 0.0626 | No | ||
| 12 | PHC2 | 1430433 | 2935 | 0.928 | 0.0543 | No | ||
| 13 | EXT1 | 4540603 | 3430 | 0.631 | 0.0324 | No | ||
| 14 | CSTF1 | 4610129 | 4253 | 0.366 | -0.0093 | No | ||
| 15 | YTHDF3 | 4540632 4670717 7040609 | 4376 | 0.338 | -0.0133 | No | ||
| 16 | CDYL | 4200142 4730397 6060400 | 4739 | 0.276 | -0.0308 | No | ||
| 17 | KIF2A | 3990286 6130575 | 5296 | 0.204 | -0.0593 | No | ||
| 18 | ZC3H8 | 3360524 | 5379 | 0.195 | -0.0623 | No | ||
| 19 | TRAM2 | 3940112 | 5532 | 0.178 | -0.0691 | No | ||
| 20 | ERF | 110551 1770278 | 5856 | 0.147 | -0.0855 | No | ||
| 21 | ADORA2B | 6860253 | 5860 | 0.147 | -0.0845 | No | ||
| 22 | TUSC2 | 1580253 | 6642 | 0.101 | -0.1259 | No | ||
| 23 | POGZ | 870348 7040286 | 6775 | 0.095 | -0.1323 | No | ||
| 24 | RRS1 | 4560551 | 6805 | 0.094 | -0.1332 | No | ||
| 25 | E2F3 | 50162 460180 | 7547 | 0.066 | -0.1727 | No | ||
| 26 | AMD1 | 6290128 | 7786 | 0.060 | -0.1850 | No | ||
| 27 | PMM2 | 670673 2570044 2690093 4540068 6450056 | 7888 | 0.057 | -0.1901 | No | ||
| 28 | SCHIP1 | 4560152 | 8731 | 0.038 | -0.2352 | No | ||
| 29 | TIPARP | 50397 | 9029 | 0.032 | -0.2510 | No | ||
| 30 | HMGA2 | 2940121 3390647 5130279 6400136 | 10643 | 0.005 | -0.3379 | No | ||
| 31 | MYC | 380541 4670170 | 10764 | 0.003 | -0.3444 | No | ||
| 32 | MFAP1 | 6660092 | 10988 | -0.001 | -0.3564 | No | ||
| 33 | SHOC2 | 1340064 1570546 | 11721 | -0.015 | -0.3958 | No | ||
| 34 | FOXF2 | 1240091 | 11899 | -0.018 | -0.4052 | No | ||
| 35 | NUP153 | 7000452 | 12122 | -0.023 | -0.4170 | No | ||
| 36 | ARHGEF7 | 1690441 | 13151 | -0.053 | -0.4720 | No | ||
| 37 | DDX3Y | 1580278 4200519 | 13871 | -0.096 | -0.5101 | No | ||
| 38 | BAG5 | 2230368 6420537 | 14411 | -0.162 | -0.5380 | No | ||
| 39 | CYR61 | 1240408 5290026 4120452 6550008 | 14560 | -0.192 | -0.5445 | No | ||
| 40 | WEE1 | 3390070 | 14754 | -0.240 | -0.5531 | No | ||
| 41 | BLCAP | 3990253 | 14892 | -0.282 | -0.5584 | No | ||
| 42 | BRD8 | 1170463 2900075 4050397 6590332 | 15081 | -0.338 | -0.5661 | No | ||
| 43 | COIL | 4480408 | 15136 | -0.357 | -0.5663 | No | ||
| 44 | FADD | 2360593 4210692 6520019 | 15264 | -0.410 | -0.5701 | No | ||
| 45 | CNOT2 | 520546 2060397 4610543 5550113 | 15266 | -0.410 | -0.5672 | No | ||
| 46 | SIAH2 | 7210672 | 15402 | -0.479 | -0.5709 | No | ||
| 47 | BAIAP2 | 460347 4730600 | 15537 | -0.544 | -0.5741 | No | ||
| 48 | TNFAIP8 | 2760551 | 16027 | -0.838 | -0.5942 | No | ||
| 49 | CNOT4 | 2320242 6760706 | 16037 | -0.844 | -0.5885 | No | ||
| 50 | CASP8 | 4850154 | 16116 | -0.908 | -0.5859 | No | ||
| 51 | RYBP | 60746 | 16923 | -1.658 | -0.6171 | Yes | ||
| 52 | SPOP | 450035 | 17099 | -1.844 | -0.6129 | Yes | ||
| 53 | CENPA | 5080154 | 17168 | -1.922 | -0.6023 | Yes | ||
| 54 | TLK1 | 7100605 | 17174 | -1.931 | -0.5882 | Yes | ||
| 55 | HMGCR | 2630242 | 17290 | -2.099 | -0.5789 | Yes | ||
| 56 | CHD1 | 4590048 | 17402 | -2.277 | -0.5680 | Yes | ||
| 57 | SOX4 | 2260091 | 17418 | -2.295 | -0.5518 | Yes | ||
| 58 | CTCF | 5340017 | 17438 | -2.325 | -0.5356 | Yes | ||
| 59 | NAGK | 730041 3170086 5890053 | 17456 | -2.345 | -0.5191 | Yes | ||
| 60 | WSB1 | 870563 | 17696 | -2.818 | -0.5111 | Yes | ||
| 61 | GATA3 | 6130068 | 17892 | -3.243 | -0.4976 | Yes | ||
| 62 | TLK2 | 1170161 | 17995 | -3.517 | -0.4770 | Yes | ||
| 63 | KLF7 | 50390 | 18105 | -3.812 | -0.4546 | Yes | ||
| 64 | POLS | 5890438 | 18150 | -3.977 | -0.4275 | Yes | ||
| 65 | KBTBD2 | 2320014 | 18277 | -4.613 | -0.4001 | Yes | ||
| 66 | DYRK1A | 3190181 | 18327 | -4.895 | -0.3664 | Yes | ||
| 67 | MARK3 | 2370450 | 18367 | -5.158 | -0.3303 | Yes | ||
| 68 | BRD1 | 1660278 | 18387 | -5.339 | -0.2917 | Yes | ||
| 69 | CRKL | 4050427 | 18419 | -5.557 | -0.2522 | Yes | ||
| 70 | IL4R | 2370520 | 18461 | -5.919 | -0.2105 | Yes | ||
| 71 | NEDD4L | 6380368 | 18501 | -6.244 | -0.1663 | Yes | ||
| 72 | ARL4C | 1190279 | 18537 | -6.840 | -0.1175 | Yes | ||
| 73 | TNFAIP3 | 2900142 | 18558 | -7.288 | -0.0645 | Yes | ||
| 74 | TNFRSF1A | 1090390 6520735 | 18612 | -9.119 | 0.0002 | Yes |