Profile of the Running ES Score & Positions of GeneSet Members on the Rank Ordered List
| Dataset | Set_03_absentNotch_versus_truncNotch.phenotype_absentNotch_versus_truncNotch.cls #truncNotch_versus_absentNotch |
| Phenotype | phenotype_absentNotch_versus_truncNotch.cls#truncNotch_versus_absentNotch |
| Upregulated in class | absentNotch |
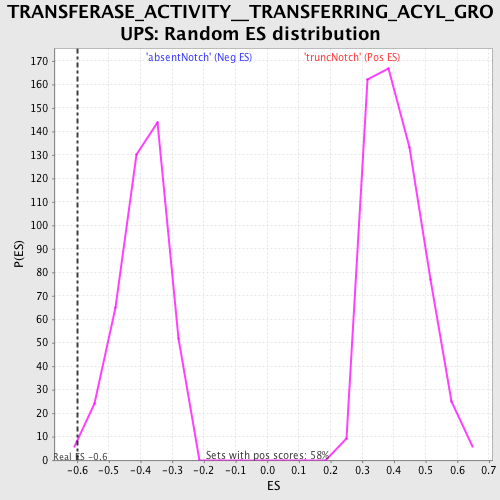
| GeneSet | TRANSFERASE_ACTIVITY__TRANSFERRING_ACYL_GROUPS |
| Enrichment Score (ES) | -0.5990012 |
| Normalized Enrichment Score (NES) | -1.5201699 |
| Nominal p-value | 0.014251782 |
| FDR q-value | 0.6623584 |
| FWER p-Value | 1.0 |
| PROBE | DESCRIPTION (from dataset) | GENE SYMBOL | GENE_TITLE | RANK IN GENE LIST | RANK METRIC SCORE | RUNNING ES | CORE ENRICHMENT | |
|---|---|---|---|---|---|---|---|---|
| 1 | DGAT1 | 1850538 | 1070 | 1.947 | -0.0164 | No | ||
| 2 | MYST3 | 5270500 | 1396 | 1.648 | 0.0011 | No | ||
| 3 | GNPAT | 5360377 | 1597 | 1.507 | 0.0222 | No | ||
| 4 | AGPAT2 | 6110592 | 1726 | 1.433 | 0.0457 | No | ||
| 5 | MYST1 | 2190397 | 2196 | 1.076 | 0.0432 | No | ||
| 6 | LASS5 | 380215 | 3081 | 0.616 | 0.0087 | No | ||
| 7 | ALAS2 | 6550176 | 3551 | 0.458 | -0.0069 | No | ||
| 8 | SOAT2 | 1230324 3610603 | 3810 | 0.393 | -0.0124 | No | ||
| 9 | NARG1 | 5910563 6350095 | 4098 | 0.334 | -0.0208 | No | ||
| 10 | TAF5 | 3450288 5890193 6860435 | 4591 | 0.254 | -0.0419 | No | ||
| 11 | CPT1B | 940086 2690433 | 4706 | 0.240 | -0.0430 | No | ||
| 12 | GLYAT | 6200239 | 5342 | 0.171 | -0.0735 | No | ||
| 13 | MYST2 | 4540494 | 5586 | 0.153 | -0.0834 | No | ||
| 14 | LRAT | 5130603 | 5817 | 0.136 | -0.0929 | No | ||
| 15 | TGM3 | 840576 | 7730 | 0.056 | -0.1947 | No | ||
| 16 | LASS1 | 3440746 6110152 | 8060 | 0.049 | -0.2113 | No | ||
| 17 | NAT1 | 2480348 | 8128 | 0.047 | -0.2140 | No | ||
| 18 | TGM1 | 1090500 | 8352 | 0.042 | -0.2251 | No | ||
| 19 | ELP4 | 1230576 | 8484 | 0.040 | -0.2313 | No | ||
| 20 | CPT1A | 6350093 | 8589 | 0.038 | -0.2361 | No | ||
| 21 | HADHA | 3190041 | 8642 | 0.036 | -0.2381 | No | ||
| 22 | AANAT | 610609 | 9042 | 0.028 | -0.2590 | No | ||
| 23 | CROT | 2260433 | 10283 | 0.007 | -0.3256 | No | ||
| 24 | TGM5 | 4060333 6510079 | 10801 | -0.002 | -0.3534 | No | ||
| 25 | MYST4 | 1400563 2570687 3360458 6840402 | 13280 | -0.061 | -0.4856 | No | ||
| 26 | NAT2 | 6760195 | 13345 | -0.064 | -0.4877 | No | ||
| 27 | ACAT1 | 3170600 630438 | 13510 | -0.071 | -0.4950 | No | ||
| 28 | ACSL3 | 3140195 | 13515 | -0.072 | -0.4937 | No | ||
| 29 | GGTLA1 | 3140273 4920168 | 14109 | -0.112 | -0.5233 | No | ||
| 30 | ATE1 | 290491 6940722 | 15465 | -0.407 | -0.5876 | Yes | ||
| 31 | HADHB | 60064 2690670 | 15553 | -0.436 | -0.5831 | Yes | ||
| 32 | TGM2 | 5360452 | 15850 | -0.555 | -0.5872 | Yes | ||
| 33 | SPTLC2 | 6840324 520017 | 16061 | -0.652 | -0.5847 | Yes | ||
| 34 | CS | 5080600 | 16078 | -0.656 | -0.5717 | Yes | ||
| 35 | NCOA3 | 4540195 | 16332 | -0.802 | -0.5683 | Yes | ||
| 36 | BRCA2 | 4280372 | 16352 | -0.810 | -0.5522 | Yes | ||
| 37 | SAT1 | 4570463 | 16537 | -0.916 | -0.5427 | Yes | ||
| 38 | PNPLA3 | 5050551 | 16545 | -0.923 | -0.5235 | Yes | ||
| 39 | SPTLC1 | 4070561 610156 | 16578 | -0.946 | -0.5052 | Yes | ||
| 40 | DGAT2 | 5130685 | 17044 | -1.266 | -0.5034 | Yes | ||
| 41 | GTF3C4 | 1940750 4730114 | 17416 | -1.664 | -0.4881 | Yes | ||
| 42 | HMGCS1 | 6620452 | 18065 | -2.584 | -0.4682 | Yes | ||
| 43 | CREBBP | 5690035 7040050 | 18081 | -2.625 | -0.4134 | Yes | ||
| 44 | SMARCE1 | 4920465 4390398 | 18281 | -3.093 | -0.3586 | Yes | ||
| 45 | SOAT1 | 1190019 | 18328 | -3.267 | -0.2918 | Yes | ||
| 46 | HAT1 | 3710082 | 18484 | -3.945 | -0.2165 | Yes | ||
| 47 | ACLY | 1740609 | 18552 | -4.517 | -0.1244 | Yes | ||
| 48 | EDF1 | 1660035 2640161 | 18606 | -6.032 | 0.0005 | Yes |