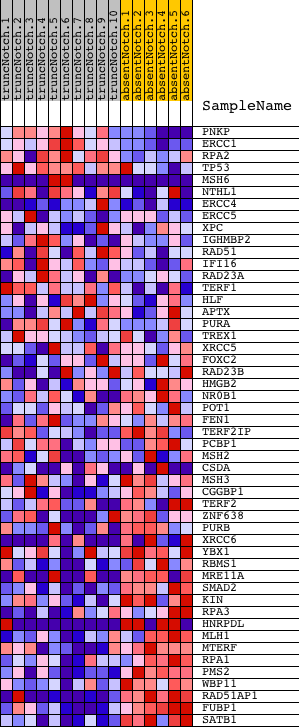
Profile of the Running ES Score & Positions of GeneSet Members on the Rank Ordered List
| Dataset | Set_03_absentNotch_versus_truncNotch.phenotype_absentNotch_versus_truncNotch.cls #truncNotch_versus_absentNotch |
| Phenotype | phenotype_absentNotch_versus_truncNotch.cls#truncNotch_versus_absentNotch |
| Upregulated in class | absentNotch |
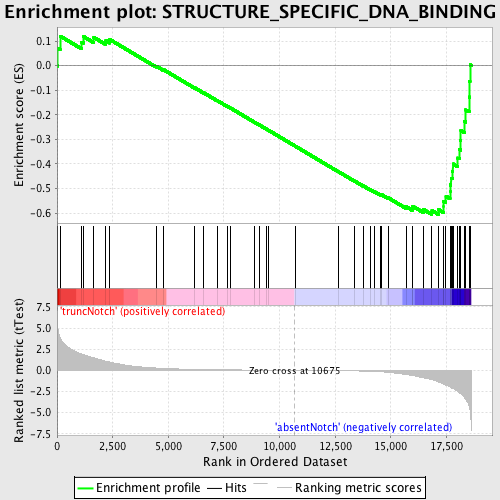
| GeneSet | STRUCTURE_SPECIFIC_DNA_BINDING |
| Enrichment Score (ES) | -0.6057827 |
| Normalized Enrichment Score (NES) | -1.5408669 |
| Nominal p-value | 0.01173709 |
| FDR q-value | 0.6810725 |
| FWER p-Value | 0.999 |
| PROBE | DESCRIPTION (from dataset) | GENE SYMBOL | GENE_TITLE | RANK IN GENE LIST | RANK METRIC SCORE | RUNNING ES | CORE ENRICHMENT | |
|---|---|---|---|---|---|---|---|---|
| 1 | PNKP | 4610685 5720605 | 38 | 4.908 | 0.0692 | No | ||
| 2 | ERCC1 | 3800010 4590132 4670397 | 137 | 3.855 | 0.1199 | No | ||
| 3 | RPA2 | 2760301 5420195 | 1107 | 1.909 | 0.0954 | No | ||
| 4 | TP53 | 6130707 | 1179 | 1.852 | 0.1185 | No | ||
| 5 | MSH6 | 4480064 6520093 | 1649 | 1.483 | 0.1147 | No | ||
| 6 | NTHL1 | 4920148 | 2193 | 1.078 | 0.1011 | No | ||
| 7 | ERCC4 | 1570619 5720180 | 2369 | 0.987 | 0.1060 | No | ||
| 8 | ERCC5 | 770025 4540692 | 4452 | 0.275 | -0.0021 | No | ||
| 9 | XPC | 6370193 | 4793 | 0.231 | -0.0171 | No | ||
| 10 | IGHMBP2 | 2350292 | 6190 | 0.113 | -0.0906 | No | ||
| 11 | RAD51 | 6110450 6980280 | 6595 | 0.093 | -0.1110 | No | ||
| 12 | IFI16 | 6520601 | 7205 | 0.071 | -0.1428 | No | ||
| 13 | RAD23A | 670082 5270309 5360463 5550364 | 7638 | 0.058 | -0.1652 | No | ||
| 14 | TERF1 | 2340113 | 7810 | 0.055 | -0.1736 | No | ||
| 15 | HLF | 2370113 | 8873 | 0.031 | -0.2303 | No | ||
| 16 | APTX | 3360041 4560167 | 9096 | 0.027 | -0.2419 | No | ||
| 17 | PURA | 3870156 | 9424 | 0.021 | -0.2592 | No | ||
| 18 | TREX1 | 3450040 7100692 | 9505 | 0.020 | -0.2632 | No | ||
| 19 | XRCC5 | 7100286 | 10724 | -0.001 | -0.3288 | No | ||
| 20 | FOXC2 | 4150041 | 12642 | -0.040 | -0.4315 | No | ||
| 21 | RAD23B | 2190671 | 13382 | -0.065 | -0.4703 | No | ||
| 22 | HMGB2 | 2640603 | 13760 | -0.085 | -0.4894 | No | ||
| 23 | NR0B1 | 6510750 | 14074 | -0.109 | -0.5047 | No | ||
| 24 | POT1 | 5340184 | 14277 | -0.130 | -0.5137 | No | ||
| 25 | FEN1 | 1770541 | 14554 | -0.166 | -0.5261 | No | ||
| 26 | TERF2IP | 580010 870364 2190358 | 14584 | -0.172 | -0.5252 | No | ||
| 27 | PCBP1 | 1050088 | 14874 | -0.229 | -0.5374 | No | ||
| 28 | MSH2 | 6180273 | 15689 | -0.488 | -0.5742 | No | ||
| 29 | CSDA | 2470092 3060053 4780056 | 15961 | -0.610 | -0.5799 | No | ||
| 30 | MSH3 | 6770575 | 15968 | -0.612 | -0.5714 | No | ||
| 31 | CGGBP1 | 4810053 | 16476 | -0.886 | -0.5858 | No | ||
| 32 | TERF2 | 3840044 | 16848 | -1.093 | -0.5899 | Yes | ||
| 33 | ZNF638 | 6510112 | 17142 | -1.369 | -0.5858 | Yes | ||
| 34 | PURB | 5360138 | 17367 | -1.611 | -0.5745 | Yes | ||
| 35 | XRCC6 | 2850450 3870528 | 17370 | -1.614 | -0.5512 | Yes | ||
| 36 | YBX1 | 1340039 4730500 | 17479 | -1.739 | -0.5317 | Yes | ||
| 37 | RBMS1 | 6400014 | 17662 | -1.950 | -0.5132 | Yes | ||
| 38 | MRE11A | 3850601 4670332 | 17669 | -1.971 | -0.4849 | Yes | ||
| 39 | SMAD2 | 4200592 | 17704 | -2.023 | -0.4574 | Yes | ||
| 40 | KIN | 6550014 | 17779 | -2.124 | -0.4306 | Yes | ||
| 41 | RPA3 | 5700136 | 17794 | -2.144 | -0.4002 | Yes | ||
| 42 | HNRPDL | 1050102 1090181 5360471 | 18013 | -2.480 | -0.3759 | Yes | ||
| 43 | MLH1 | 6450168 | 18082 | -2.626 | -0.3415 | Yes | ||
| 44 | MTERF | 6650441 | 18133 | -2.745 | -0.3043 | Yes | ||
| 45 | RPA1 | 360452 | 18150 | -2.775 | -0.2649 | Yes | ||
| 46 | PMS2 | 6760739 | 18306 | -3.192 | -0.2269 | Yes | ||
| 47 | WBP11 | 6450725 | 18372 | -3.441 | -0.1805 | Yes | ||
| 48 | RAD51AP1 | 4050736 6370528 | 18523 | -4.193 | -0.1277 | Yes | ||
| 49 | FUBP1 | 5390373 | 18545 | -4.465 | -0.0640 | Yes | ||
| 50 | SATB1 | 5670154 | 18561 | -4.668 | 0.0030 | Yes |