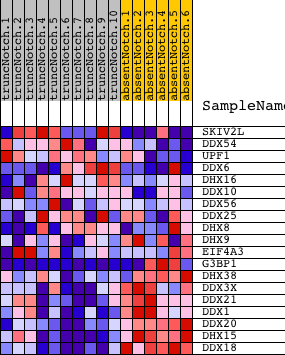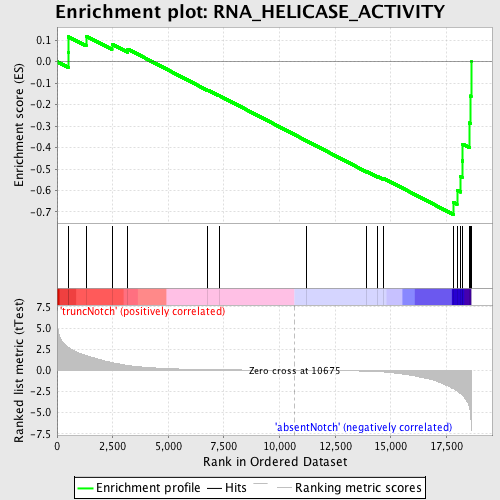
Profile of the Running ES Score & Positions of GeneSet Members on the Rank Ordered List
| Dataset | Set_03_absentNotch_versus_truncNotch.phenotype_absentNotch_versus_truncNotch.cls #truncNotch_versus_absentNotch |
| Phenotype | phenotype_absentNotch_versus_truncNotch.cls#truncNotch_versus_absentNotch |
| Upregulated in class | absentNotch |
| GeneSet | RNA_HELICASE_ACTIVITY |
| Enrichment Score (ES) | -0.71172106 |
| Normalized Enrichment Score (NES) | -1.5243088 |
| Nominal p-value | 0.032894738 |
| FDR q-value | 0.6716457 |
| FWER p-Value | 1.0 |
| PROBE | DESCRIPTION (from dataset) | GENE SYMBOL | GENE_TITLE | RANK IN GENE LIST | RANK METRIC SCORE | RUNNING ES | CORE ENRICHMENT | |
|---|---|---|---|---|---|---|---|---|
| 1 | SKIV2L | 3780278 4570092 | 500 | 2.719 | 0.0452 | No | ||
| 2 | DDX54 | 6220324 | 512 | 2.688 | 0.1159 | No | ||
| 3 | UPF1 | 430164 1190750 | 1306 | 1.735 | 0.1193 | No | ||
| 4 | DDX6 | 2630025 6770408 | 2468 | 0.929 | 0.0815 | No | ||
| 5 | DHX16 | 940044 | 3178 | 0.582 | 0.0588 | No | ||
| 6 | DDX10 | 520746 | 6767 | 0.086 | -0.1318 | No | ||
| 7 | DDX56 | 2030195 | 7278 | 0.069 | -0.1574 | No | ||
| 8 | DDX25 | 5910121 | 11214 | -0.009 | -0.3688 | No | ||
| 9 | DHX8 | 6100139 | 13917 | -0.096 | -0.5115 | No | ||
| 10 | DHX9 | 60017 1170095 2260014 | 14415 | -0.148 | -0.5343 | No | ||
| 11 | EIF4A3 | 3440538 | 14654 | -0.185 | -0.5422 | No | ||
| 12 | G3BP1 | 4780373 7100450 7100576 | 17808 | -2.161 | -0.6544 | Yes | ||
| 13 | DHX38 | 780243 | 17977 | -2.415 | -0.5994 | Yes | ||
| 14 | DDX3X | 2190020 | 18122 | -2.725 | -0.5349 | Yes | ||
| 15 | DDX21 | 6100446 | 18207 | -2.918 | -0.4620 | Yes | ||
| 16 | DDX1 | 3450047 | 18229 | -2.974 | -0.3843 | Yes | ||
| 17 | DDX20 | 3290348 | 18537 | -4.358 | -0.2852 | Yes | ||
| 18 | DHX15 | 870632 | 18572 | -4.807 | -0.1596 | Yes | ||
| 19 | DDX18 | 6980619 | 18608 | -6.105 | 0.0004 | Yes |