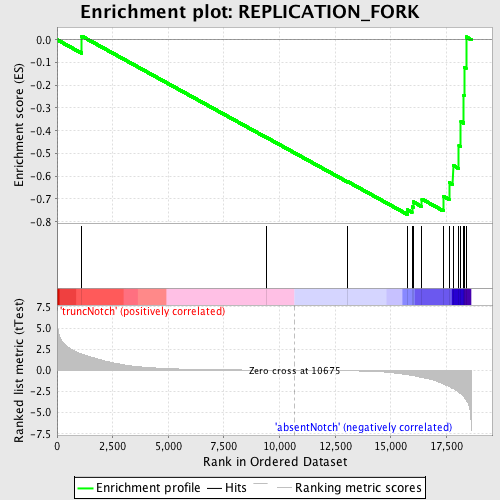
Profile of the Running ES Score & Positions of GeneSet Members on the Rank Ordered List
| Dataset | Set_03_absentNotch_versus_truncNotch.phenotype_absentNotch_versus_truncNotch.cls #truncNotch_versus_absentNotch |
| Phenotype | phenotype_absentNotch_versus_truncNotch.cls#truncNotch_versus_absentNotch |
| Upregulated in class | absentNotch |
| GeneSet | REPLICATION_FORK |
| Enrichment Score (ES) | -0.76808643 |
| Normalized Enrichment Score (NES) | -1.5352126 |
| Nominal p-value | 0.01746725 |
| FDR q-value | 0.67512816 |
| FWER p-Value | 1.0 |
| PROBE | DESCRIPTION (from dataset) | GENE SYMBOL | GENE_TITLE | RANK IN GENE LIST | RANK METRIC SCORE | RUNNING ES | CORE ENRICHMENT | |
|---|---|---|---|---|---|---|---|---|
| 1 | RPA2 | 2760301 5420195 | 1107 | 1.909 | 0.0159 | No | ||
| 2 | PURA | 3870156 | 9424 | 0.021 | -0.4303 | No | ||
| 3 | POLA1 | 4760541 | 13060 | -0.053 | -0.6236 | No | ||
| 4 | CDT1 | 3780682 | 15749 | -0.514 | -0.7478 | Yes | ||
| 5 | MCM7 | 3290292 5220056 | 15954 | -0.607 | -0.7347 | Yes | ||
| 6 | MCM3 | 5570068 | 16006 | -0.627 | -0.7127 | Yes | ||
| 7 | RFC5 | 3800452 6020091 | 16398 | -0.838 | -0.7006 | Yes | ||
| 8 | PURB | 5360138 | 17367 | -1.611 | -0.6890 | Yes | ||
| 9 | RFC3 | 1980600 | 17624 | -1.896 | -0.6278 | Yes | ||
| 10 | RPA3 | 5700136 | 17794 | -2.144 | -0.5521 | Yes | ||
| 11 | RFC1 | 1190673 | 18061 | -2.570 | -0.4649 | Yes | ||
| 12 | RPA1 | 360452 | 18150 | -2.775 | -0.3599 | Yes | ||
| 13 | PCNA | 940754 | 18279 | -3.090 | -0.2447 | Yes | ||
| 14 | RFC4 | 3800082 6840142 | 18298 | -3.159 | -0.1207 | Yes | ||
| 15 | BCL6 | 940100 | 18384 | -3.485 | 0.0125 | Yes |

