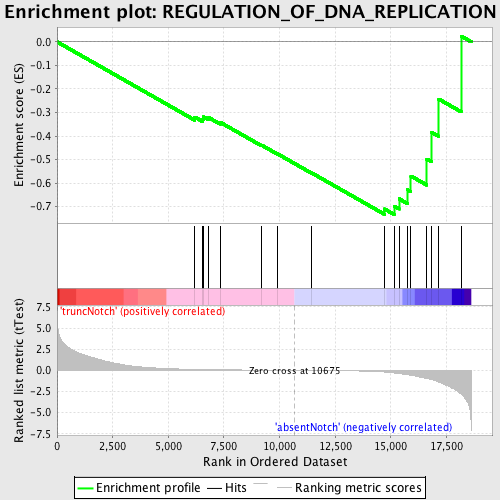
Profile of the Running ES Score & Positions of GeneSet Members on the Rank Ordered List
| Dataset | Set_03_absentNotch_versus_truncNotch.phenotype_absentNotch_versus_truncNotch.cls #truncNotch_versus_absentNotch |
| Phenotype | phenotype_absentNotch_versus_truncNotch.cls#truncNotch_versus_absentNotch |
| Upregulated in class | absentNotch |
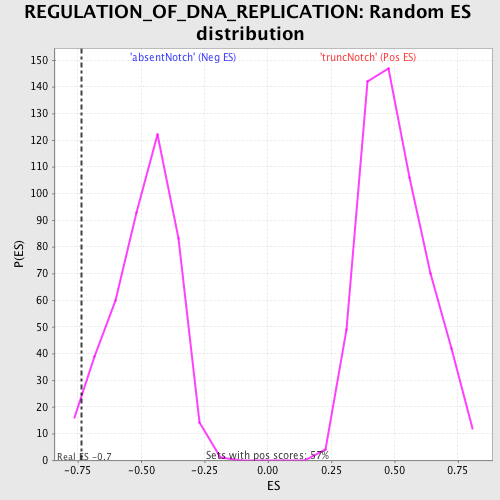
| GeneSet | REGULATION_OF_DNA_REPLICATION |
| Enrichment Score (ES) | -0.7333242 |
| Normalized Enrichment Score (NES) | -1.5045813 |
| Nominal p-value | 0.03504673 |
| FDR q-value | 0.6646715 |
| FWER p-Value | 1.0 |
| PROBE | DESCRIPTION (from dataset) | GENE SYMBOL | GENE_TITLE | RANK IN GENE LIST | RANK METRIC SCORE | RUNNING ES | CORE ENRICHMENT | |
|---|---|---|---|---|---|---|---|---|
| 1 | GLI2 | 3060632 | 6184 | 0.114 | -0.3194 | No | ||
| 2 | NBN | 730538 2470619 4780594 | 6543 | 0.095 | -0.3277 | No | ||
| 3 | S100A11 | 2260064 | 6577 | 0.094 | -0.3187 | No | ||
| 4 | RAD9A | 110300 1940632 3990390 6040014 | 6817 | 0.084 | -0.3218 | No | ||
| 5 | EREG | 50519 4920129 | 7329 | 0.067 | -0.3416 | No | ||
| 6 | WRNIP1 | 2320541 5890725 | 9188 | 0.025 | -0.4386 | No | ||
| 7 | NF2 | 4150735 6450139 | 9899 | 0.013 | -0.4753 | No | ||
| 8 | GLI1 | 4560176 | 11450 | -0.014 | -0.5571 | No | ||
| 9 | TIPIN | 1570301 2480113 | 14713 | -0.197 | -0.7099 | Yes | ||
| 10 | CDC45L | 70537 3130114 | 15150 | -0.305 | -0.6983 | Yes | ||
| 11 | RAD17 | 5220739 | 15371 | -0.377 | -0.6668 | Yes | ||
| 12 | CDT1 | 3780682 | 15749 | -0.514 | -0.6281 | Yes | ||
| 13 | CDC6 | 4570296 5360600 | 15903 | -0.578 | -0.5700 | Yes | ||
| 14 | GMNN | 2630148 | 16617 | -0.965 | -0.4977 | Yes | ||
| 15 | CDK2 | 130484 2260301 4010088 5050110 | 16838 | -1.088 | -0.3847 | Yes | ||
| 16 | ATR | 6860273 | 17157 | -1.381 | -0.2433 | Yes | ||
| 17 | GTPBP4 | 6840332 | 18162 | -2.804 | 0.0244 | Yes |