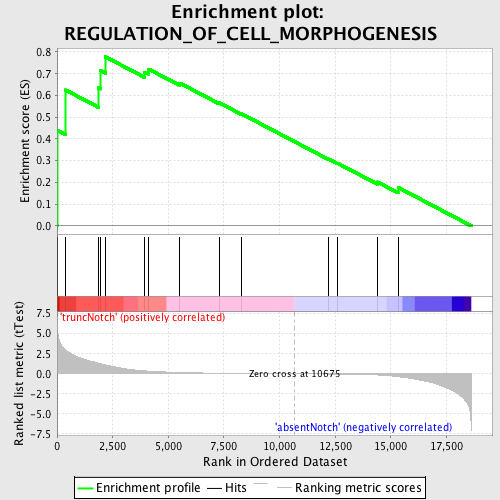
Profile of the Running ES Score & Positions of GeneSet Members on the Rank Ordered List
| Dataset | Set_03_absentNotch_versus_truncNotch.phenotype_absentNotch_versus_truncNotch.cls #truncNotch_versus_absentNotch |
| Phenotype | phenotype_absentNotch_versus_truncNotch.cls#truncNotch_versus_absentNotch |
| Upregulated in class | truncNotch |
| GeneSet | REGULATION_OF_CELL_MORPHOGENESIS |
| Enrichment Score (ES) | 0.7776594 |
| Normalized Enrichment Score (NES) | 1.5131838 |
| Nominal p-value | 0.011131725 |
| FDR q-value | 0.9408101 |
| FWER p-Value | 1.0 |
| PROBE | DESCRIPTION (from dataset) | GENE SYMBOL | GENE_TITLE | RANK IN GENE LIST | RANK METRIC SCORE | RUNNING ES | CORE ENRICHMENT | |
|---|---|---|---|---|---|---|---|---|
| 1 | CDC42EP4 | 4150338 | 6 | 6.410 | 0.4396 | Yes | ||
| 2 | MYH9 | 3120091 4850292 | 374 | 2.994 | 0.6253 | Yes | ||
| 3 | FGD1 | 4780021 | 1866 | 1.302 | 0.6345 | Yes | ||
| 4 | FGD3 | 5690465 | 1956 | 1.236 | 0.7146 | Yes | ||
| 5 | FGD2 | 5340195 | 2173 | 1.089 | 0.7777 | Yes | ||
| 6 | CDC42 | 1240168 3440278 4480519 5290162 | 3938 | 0.365 | 0.7079 | No | ||
| 7 | CENTD2 | 60408 2510156 6100494 | 4111 | 0.332 | 0.7215 | No | ||
| 8 | CDC42EP1 | 6550279 6370215 4060450 4590066 | 5510 | 0.159 | 0.6572 | No | ||
| 9 | FGD5 | 3520438 4060500 | 7279 | 0.069 | 0.5669 | No | ||
| 10 | TAOK2 | 110575 6380692 | 8286 | 0.043 | 0.5158 | No | ||
| 11 | CDC42EP5 | 6400397 | 12192 | -0.029 | 0.3079 | No | ||
| 12 | FGD4 | 520168 870411 2640253 6550338 6650364 | 12601 | -0.039 | 0.2886 | No | ||
| 13 | CDC42EP2 | 540079 2970138 | 14396 | -0.144 | 0.2020 | No | ||
| 14 | FGD6 | 610632 | 15330 | -0.361 | 0.1766 | No |

