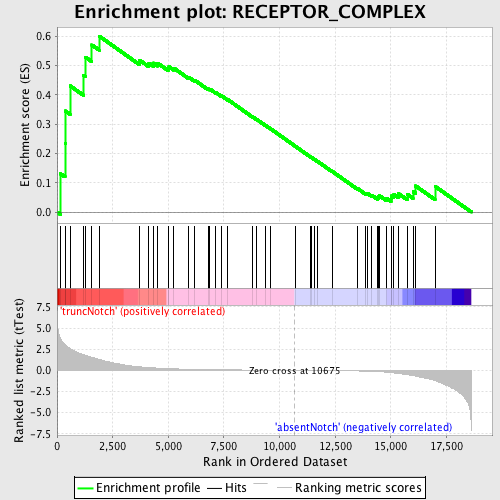
Profile of the Running ES Score & Positions of GeneSet Members on the Rank Ordered List
| Dataset | Set_03_absentNotch_versus_truncNotch.phenotype_absentNotch_versus_truncNotch.cls #truncNotch_versus_absentNotch |
| Phenotype | phenotype_absentNotch_versus_truncNotch.cls#truncNotch_versus_absentNotch |
| Upregulated in class | truncNotch |
| GeneSet | RECEPTOR_COMPLEX |
| Enrichment Score (ES) | 0.6003396 |
| Normalized Enrichment Score (NES) | 1.4586351 |
| Nominal p-value | 0.02389706 |
| FDR q-value | 0.9652621 |
| FWER p-Value | 1.0 |
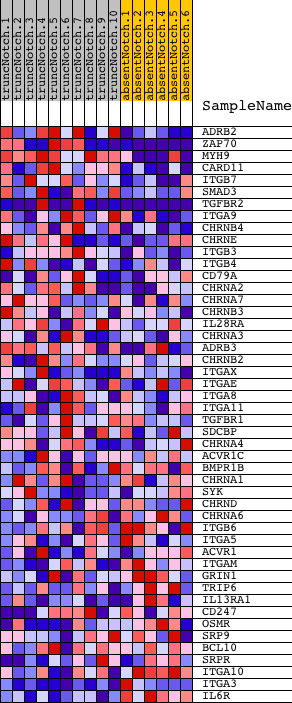
| PROBE | DESCRIPTION (from dataset) | GENE SYMBOL | GENE_TITLE | RANK IN GENE LIST | RANK METRIC SCORE | RUNNING ES | CORE ENRICHMENT | |
|---|---|---|---|---|---|---|---|---|
| 1 | ADRB2 | 3290373 | 156 | 3.712 | 0.1305 | Yes | ||
| 2 | ZAP70 | 1410494 2260504 | 358 | 3.049 | 0.2338 | Yes | ||
| 3 | MYH9 | 3120091 4850292 | 374 | 2.994 | 0.3450 | Yes | ||
| 4 | CARD11 | 70338 | 586 | 2.591 | 0.4305 | Yes | ||
| 5 | ITGB7 | 4670619 | 1187 | 1.843 | 0.4672 | Yes | ||
| 6 | SMAD3 | 6450671 | 1267 | 1.764 | 0.5289 | Yes | ||
| 7 | TGFBR2 | 1780711 1980537 6550398 | 1564 | 1.525 | 0.5701 | Yes | ||
| 8 | ITGA9 | 670180 | 1893 | 1.281 | 0.6003 | Yes | ||
| 9 | CHRNB4 | 6370110 | 3708 | 0.415 | 0.5182 | No | ||
| 10 | CHRNE | 3190170 | 4123 | 0.331 | 0.5083 | No | ||
| 11 | ITGB3 | 5270463 | 4323 | 0.296 | 0.5086 | No | ||
| 12 | ITGB4 | 1740021 3840482 | 4518 | 0.265 | 0.5081 | No | ||
| 13 | CD79A | 3450563 | 4993 | 0.208 | 0.4904 | No | ||
| 14 | CHRNA2 | 5050315 | 5026 | 0.205 | 0.4963 | No | ||
| 15 | CHRNA7 | 2970446 | 5250 | 0.179 | 0.4910 | No | ||
| 16 | CHRNB3 | 430441 870725 5720204 | 5915 | 0.129 | 0.4600 | No | ||
| 17 | IL28RA | 3710072 4920242 | 6182 | 0.114 | 0.4500 | No | ||
| 18 | CHRNA3 | 6760100 | 6795 | 0.085 | 0.4202 | No | ||
| 19 | ADRB3 | 6900072 | 6867 | 0.082 | 0.4195 | No | ||
| 20 | CHRNB2 | 580204 3120739 | 7140 | 0.073 | 0.4076 | No | ||
| 21 | ITGAX | 6130524 | 7373 | 0.065 | 0.3975 | No | ||
| 22 | ITGAE | 4210632 4670239 5340253 5420746 5690154 5700685 6770154 | 7676 | 0.058 | 0.3834 | No | ||
| 23 | ITGA8 | 4050086 | 8780 | 0.033 | 0.3253 | No | ||
| 24 | ITGA11 | 1740112 6590110 | 8980 | 0.029 | 0.3156 | No | ||
| 25 | TGFBR1 | 1400148 4280020 6550711 | 9349 | 0.022 | 0.2967 | No | ||
| 26 | SDCBP | 460487 2190039 5270441 | 9577 | 0.018 | 0.2851 | No | ||
| 27 | CHRNA4 | 730075 2680091 | 10703 | -0.000 | 0.2245 | No | ||
| 28 | ACVR1C | 5890044 | 11367 | -0.012 | 0.1893 | No | ||
| 29 | BMPR1B | 4560010 4760121 6450161 | 11432 | -0.013 | 0.1863 | No | ||
| 30 | CHRNA1 | 1170025 3610364 5220292 | 11549 | -0.016 | 0.1807 | No | ||
| 31 | SYK | 6940133 | 11709 | -0.018 | 0.1728 | No | ||
| 32 | CHRND | 840403 2260670 | 12359 | -0.033 | 0.1391 | No | ||
| 33 | CHRNA6 | 5340092 | 13516 | -0.072 | 0.0795 | No | ||
| 34 | ITGB6 | 2810068 4570332 | 13881 | -0.094 | 0.0634 | No | ||
| 35 | ITGA5 | 5550520 | 13934 | -0.098 | 0.0643 | No | ||
| 36 | ACVR1 | 6840671 | 14141 | -0.115 | 0.0575 | No | ||
| 37 | ITGAM | 1190373 | 14401 | -0.144 | 0.0489 | No | ||
| 38 | GRIN1 | 3800014 7000609 | 14452 | -0.152 | 0.0519 | No | ||
| 39 | TRIP6 | 6520609 | 14485 | -0.157 | 0.0561 | No | ||
| 40 | IL13RA1 | 5550609 | 14804 | -0.214 | 0.0470 | No | ||
| 41 | CD247 | 3800725 5720136 | 15011 | -0.264 | 0.0457 | No | ||
| 42 | OSMR | 1990519 | 15029 | -0.270 | 0.0549 | No | ||
| 43 | SRP9 | 3170053 4540538 | 15137 | -0.300 | 0.0604 | No | ||
| 44 | BCL10 | 2360397 | 15331 | -0.361 | 0.0635 | No | ||
| 45 | SRPR | 6590647 6370114 | 15738 | -0.507 | 0.0606 | No | ||
| 46 | ITGA10 | 6330438 | 16000 | -0.624 | 0.0699 | No | ||
| 47 | ITGA3 | 4570427 | 16116 | -0.675 | 0.0890 | No | ||
| 48 | IL6R | 520706 3800215 | 16989 | -1.219 | 0.0876 | No |