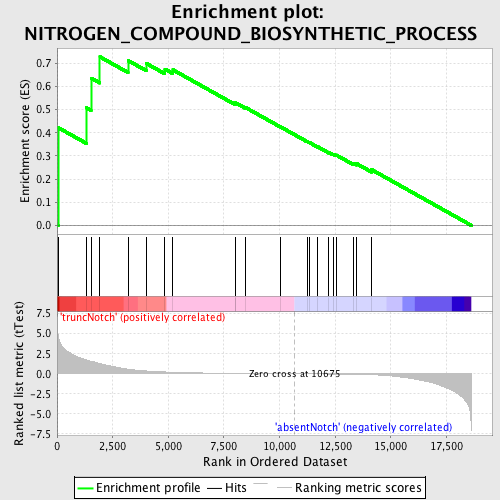
Profile of the Running ES Score & Positions of GeneSet Members on the Rank Ordered List
| Dataset | Set_03_absentNotch_versus_truncNotch.phenotype_absentNotch_versus_truncNotch.cls #truncNotch_versus_absentNotch |
| Phenotype | phenotype_absentNotch_versus_truncNotch.cls#truncNotch_versus_absentNotch |
| Upregulated in class | truncNotch |
| GeneSet | NITROGEN_COMPOUND_BIOSYNTHETIC_PROCESS |
| Enrichment Score (ES) | 0.72837526 |
| Normalized Enrichment Score (NES) | 1.5071231 |
| Nominal p-value | 0.008547009 |
| FDR q-value | 0.74198425 |
| FWER p-Value | 1.0 |
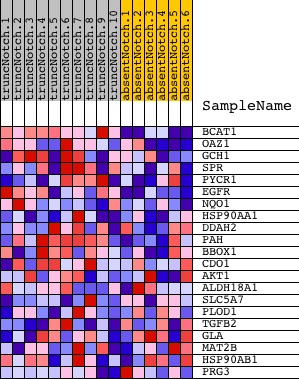
| PROBE | DESCRIPTION (from dataset) | GENE SYMBOL | GENE_TITLE | RANK IN GENE LIST | RANK METRIC SCORE | RUNNING ES | CORE ENRICHMENT | |
|---|---|---|---|---|---|---|---|---|
| 1 | BCAT1 | 3290128 4050408 | 46 | 4.735 | 0.4226 | Yes | ||
| 2 | OAZ1 | 110181 | 1323 | 1.720 | 0.5084 | Yes | ||
| 3 | GCH1 | 670364 6550358 | 1527 | 1.551 | 0.6367 | Yes | ||
| 4 | SPR | 6840170 | 1926 | 1.259 | 0.7284 | Yes | ||
| 5 | PYCR1 | 6180670 | 3189 | 0.579 | 0.7124 | No | ||
| 6 | EGFR | 4920138 6480521 | 4005 | 0.351 | 0.7002 | No | ||
| 7 | NQO1 | 3450136 6840121 | 4847 | 0.226 | 0.6752 | No | ||
| 8 | HSP90AA1 | 4560041 5220133 2120722 | 5208 | 0.182 | 0.6722 | No | ||
| 9 | DDAH2 | 4480551 | 8017 | 0.050 | 0.5256 | No | ||
| 10 | PAH | 3800309 | 8029 | 0.050 | 0.5295 | No | ||
| 11 | BBOX1 | 2030538 2370452 | 8463 | 0.040 | 0.5098 | No | ||
| 12 | CDO1 | 2480279 | 10034 | 0.011 | 0.4263 | No | ||
| 13 | AKT1 | 5290746 | 11234 | -0.010 | 0.3627 | No | ||
| 14 | ALDH18A1 | 2340601 | 11340 | -0.011 | 0.3581 | No | ||
| 15 | SLC5A7 | 4760091 | 11714 | -0.018 | 0.3397 | No | ||
| 16 | PLOD1 | 6040427 | 12218 | -0.029 | 0.3152 | No | ||
| 17 | TGFB2 | 4920292 | 12423 | -0.034 | 0.3073 | No | ||
| 18 | GLA | 4610364 | 12544 | -0.038 | 0.3042 | No | ||
| 19 | MAT2B | 1690139 2510706 | 13321 | -0.063 | 0.2682 | No | ||
| 20 | HSP90AB1 | 3170358 5390102 6040093 | 13457 | -0.068 | 0.2670 | No | ||
| 21 | PRG3 | 6220020 | 14139 | -0.115 | 0.2408 | No |