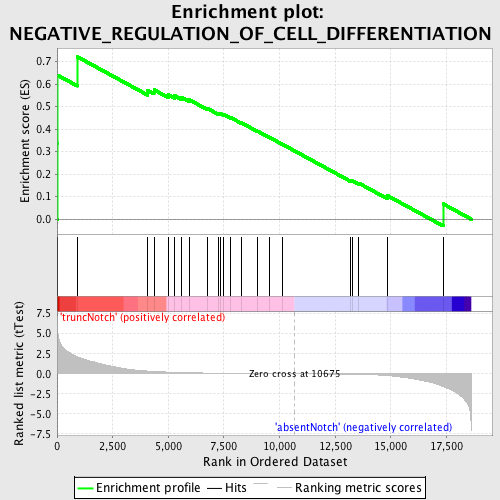
Profile of the Running ES Score & Positions of GeneSet Members on the Rank Ordered List
| Dataset | Set_03_absentNotch_versus_truncNotch.phenotype_absentNotch_versus_truncNotch.cls #truncNotch_versus_absentNotch |
| Phenotype | phenotype_absentNotch_versus_truncNotch.cls#truncNotch_versus_absentNotch |
| Upregulated in class | truncNotch |
| GeneSet | NEGATIVE_REGULATION_OF_CELL_DIFFERENTIATION |
| Enrichment Score (ES) | 0.72097826 |
| Normalized Enrichment Score (NES) | 1.5460047 |
| Nominal p-value | 0.007380074 |
| FDR q-value | 1.0 |
| FWER p-Value | 0.996 |
| PROBE | DESCRIPTION (from dataset) | GENE SYMBOL | GENE_TITLE | RANK IN GENE LIST | RANK METRIC SCORE | RUNNING ES | CORE ENRICHMENT | |
|---|---|---|---|---|---|---|---|---|
| 1 | DTX1 | 5900372 | 23 | 5.496 | 0.3357 | Yes | ||
| 2 | NOTCH1 | 3390114 | 35 | 4.954 | 0.6387 | Yes | ||
| 3 | TWIST2 | 6760433 | 914 | 2.112 | 0.7210 | Yes | ||
| 4 | SOCS5 | 3830398 7100093 | 4072 | 0.339 | 0.5720 | No | ||
| 5 | NPHP3 | 2450497 7050731 | 4357 | 0.291 | 0.5746 | No | ||
| 6 | INHA | 6100102 | 5003 | 0.206 | 0.5525 | No | ||
| 7 | IL4 | 6020537 | 5279 | 0.177 | 0.5486 | No | ||
| 8 | ZBTB16 | 3290022 | 5594 | 0.152 | 0.5411 | No | ||
| 9 | TBX3 | 2570672 | 5934 | 0.128 | 0.5307 | No | ||
| 10 | CARTPT | 6660687 | 6766 | 0.086 | 0.4913 | No | ||
| 11 | NOTCH4 | 2450040 6370707 | 7252 | 0.070 | 0.4695 | No | ||
| 12 | EREG | 50519 4920129 | 7329 | 0.067 | 0.4695 | No | ||
| 13 | GPR98 | 6400647 | 7500 | 0.062 | 0.4641 | No | ||
| 14 | CNTN4 | 1780300 5570577 6370019 | 7786 | 0.055 | 0.4522 | No | ||
| 15 | BMP4 | 380113 | 8268 | 0.044 | 0.4290 | No | ||
| 16 | MAFB | 1230471 | 8995 | 0.029 | 0.3917 | No | ||
| 17 | NF1 | 6980433 | 9532 | 0.019 | 0.3641 | No | ||
| 18 | PF4 | 6130332 | 10134 | 0.009 | 0.3323 | No | ||
| 19 | NOTCH2 | 2570397 | 13205 | -0.058 | 0.1708 | No | ||
| 20 | CALCA | 5860167 | 13292 | -0.062 | 0.1699 | No | ||
| 21 | SHH | 5570400 | 13550 | -0.073 | 0.1606 | No | ||
| 22 | CDK6 | 4920253 | 14861 | -0.226 | 0.1040 | No | ||
| 23 | LDB1 | 5270601 | 17353 | -1.597 | 0.0679 | No |

