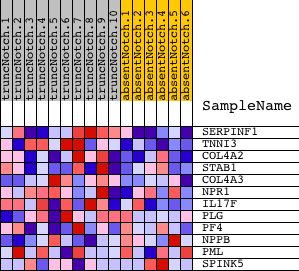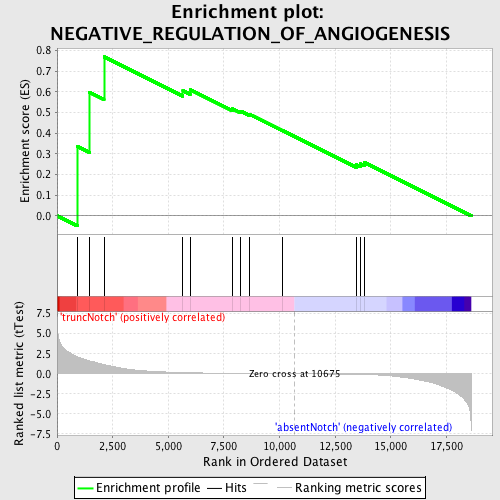
Profile of the Running ES Score & Positions of GeneSet Members on the Rank Ordered List
| Dataset | Set_03_absentNotch_versus_truncNotch.phenotype_absentNotch_versus_truncNotch.cls #truncNotch_versus_absentNotch |
| Phenotype | phenotype_absentNotch_versus_truncNotch.cls#truncNotch_versus_absentNotch |
| Upregulated in class | truncNotch |
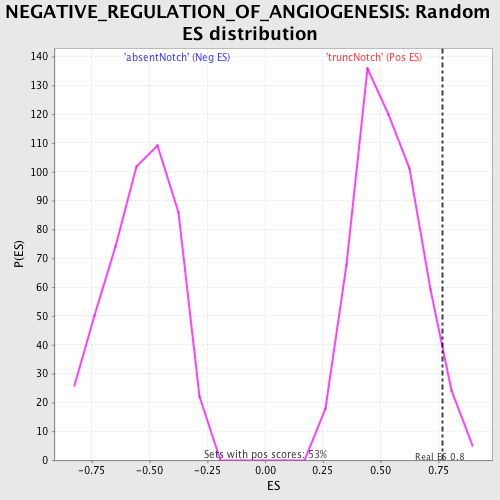
| GeneSet | NEGATIVE_REGULATION_OF_ANGIOGENESIS |
| Enrichment Score (ES) | 0.7688306 |
| Normalized Enrichment Score (NES) | 1.451327 |
| Nominal p-value | 0.04708098 |
| FDR q-value | 0.9247636 |
| FWER p-Value | 1.0 |
| PROBE | DESCRIPTION (from dataset) | GENE SYMBOL | GENE_TITLE | RANK IN GENE LIST | RANK METRIC SCORE | RUNNING ES | CORE ENRICHMENT | |
|---|---|---|---|---|---|---|---|---|
| 1 | SERPINF1 | 7040367 | 906 | 2.125 | 0.3367 | Yes | ||
| 2 | TNNI3 | 7000093 | 1456 | 1.601 | 0.5975 | Yes | ||
| 3 | COL4A2 | 2350619 | 2109 | 1.138 | 0.7688 | Yes | ||
| 4 | STAB1 | 5390707 | 5655 | 0.148 | 0.6051 | No | ||
| 5 | COL4A3 | 5910075 | 5980 | 0.125 | 0.6104 | No | ||
| 6 | NPR1 | 3840040 | 7889 | 0.053 | 0.5175 | No | ||
| 7 | IL17F | 670577 | 8252 | 0.044 | 0.5060 | No | ||
| 8 | PLG | 3360270 3840100 | 8662 | 0.036 | 0.4906 | No | ||
| 9 | PF4 | 6130332 | 10134 | 0.009 | 0.4131 | No | ||
| 10 | NPPB | 4150722 | 13455 | -0.068 | 0.2470 | No | ||
| 11 | PML | 50093 2190435 2450402 3840082 | 13638 | -0.078 | 0.2514 | No | ||
| 12 | SPINK5 | 5900010 | 13808 | -0.089 | 0.2584 | No |