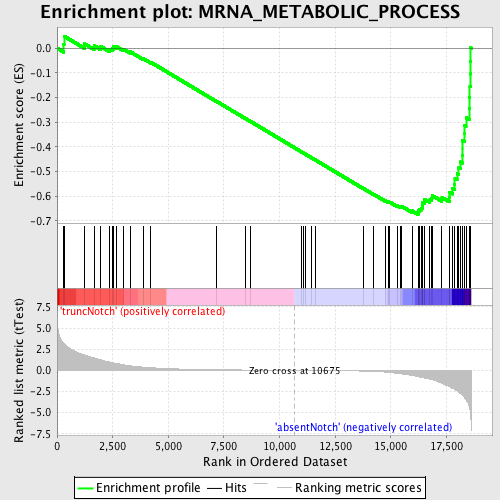
Profile of the Running ES Score & Positions of GeneSet Members on the Rank Ordered List
| Dataset | Set_03_absentNotch_versus_truncNotch.phenotype_absentNotch_versus_truncNotch.cls #truncNotch_versus_absentNotch |
| Phenotype | phenotype_absentNotch_versus_truncNotch.cls#truncNotch_versus_absentNotch |
| Upregulated in class | absentNotch |
| GeneSet | MRNA_METABOLIC_PROCESS |
| Enrichment Score (ES) | -0.6741456 |
| Normalized Enrichment Score (NES) | -1.8039622 |
| Nominal p-value | 0.0 |
| FDR q-value | 0.07930845 |
| FWER p-Value | 0.065 |
| PROBE | DESCRIPTION (from dataset) | GENE SYMBOL | GENE_TITLE | RANK IN GENE LIST | RANK METRIC SCORE | RUNNING ES | CORE ENRICHMENT | |
|---|---|---|---|---|---|---|---|---|
| 1 | SF3A2 | 3140500 | 301 | 3.190 | 0.0168 | No | ||
| 2 | GEMIN7 | 2320433 | 312 | 3.146 | 0.0488 | No | ||
| 3 | GEMIN5 | 3120577 | 1231 | 1.794 | 0.0179 | No | ||
| 4 | SF3A1 | 1580315 | 1663 | 1.472 | 0.0099 | No | ||
| 5 | SFRS2 | 50707 380593 | 1955 | 1.237 | 0.0071 | No | ||
| 6 | SFRS10 | 6130528 6400438 7040112 | 2363 | 0.992 | -0.0046 | No | ||
| 7 | SNRPD2 | 6110035 | 2476 | 0.923 | -0.0011 | No | ||
| 8 | SFRS9 | 3800047 | 2527 | 0.890 | 0.0054 | No | ||
| 9 | ZFP36 | 2030605 | 2673 | 0.812 | 0.0060 | No | ||
| 10 | SFRS8 | 5130162 5700164 | 2996 | 0.650 | -0.0046 | No | ||
| 11 | DDX39 | 3840148 | 3294 | 0.541 | -0.0150 | No | ||
| 12 | NONO | 7050014 | 3881 | 0.377 | -0.0427 | No | ||
| 13 | PTBP1 | 4070736 | 4215 | 0.315 | -0.0574 | No | ||
| 14 | CUGBP1 | 450292 510022 7050176 7050215 | 7149 | 0.073 | -0.2147 | No | ||
| 15 | LSM5 | 4540398 | 8480 | 0.040 | -0.2860 | No | ||
| 16 | SSB | 460286 3140717 | 8687 | 0.035 | -0.2967 | No | ||
| 17 | SF3B3 | 3710044 | 10980 | -0.005 | -0.4202 | No | ||
| 18 | CPSF3 | 2480671 | 11058 | -0.006 | -0.4243 | No | ||
| 19 | GEMIN6 | 2120288 3830176 | 11185 | -0.009 | -0.4310 | No | ||
| 20 | AUH | 5570152 | 11416 | -0.013 | -0.4432 | No | ||
| 21 | SLBP | 6220601 | 11603 | -0.016 | -0.4531 | No | ||
| 22 | CSTF3 | 3850156 5570458 | 13768 | -0.086 | -0.5688 | No | ||
| 23 | PPARGC1A | 4670040 | 14233 | -0.125 | -0.5925 | No | ||
| 24 | TXNL4A | 4120286 6510242 | 14746 | -0.204 | -0.6180 | No | ||
| 25 | NUDT21 | 1240167 | 14876 | -0.230 | -0.6226 | No | ||
| 26 | CRNKL1 | 5050097 | 14951 | -0.248 | -0.6240 | No | ||
| 27 | ELAVL4 | 50735 3360086 5220167 | 15306 | -0.352 | -0.6394 | No | ||
| 28 | PRPF31 | 6100360 | 15442 | -0.399 | -0.6426 | No | ||
| 29 | FUSIP1 | 520082 5390114 | 15473 | -0.410 | -0.6400 | No | ||
| 30 | SNW1 | 4010736 | 15957 | -0.608 | -0.6597 | No | ||
| 31 | RNGTT | 780152 780746 1090471 | 16226 | -0.749 | -0.6664 | Yes | ||
| 32 | PHF5A | 2690519 | 16239 | -0.753 | -0.6592 | Yes | ||
| 33 | SFRS5 | 3450176 6350008 | 16289 | -0.778 | -0.6538 | Yes | ||
| 34 | CSTF1 | 4610129 | 16358 | -0.811 | -0.6491 | Yes | ||
| 35 | LSM3 | 780164 | 16408 | -0.841 | -0.6430 | Yes | ||
| 36 | SNRPD1 | 4480162 | 16420 | -0.847 | -0.6349 | Yes | ||
| 37 | EFTUD2 | 2470707 4610148 | 16438 | -0.861 | -0.6269 | Yes | ||
| 38 | SIP1 | 2640706 | 16501 | -0.896 | -0.6209 | Yes | ||
| 39 | RNMT | 1770500 | 16504 | -0.898 | -0.6117 | Yes | ||
| 40 | SFRS7 | 2760408 | 16758 | -1.040 | -0.6146 | Yes | ||
| 41 | CPSF1 | 6290064 | 16841 | -1.090 | -0.6077 | Yes | ||
| 42 | USP39 | 1090242 3520435 4760736 | 16851 | -1.098 | -0.5969 | Yes | ||
| 43 | SMG6 | 5820243 | 17298 | -1.530 | -0.6051 | Yes | ||
| 44 | UPF2 | 4810471 | 17631 | -1.906 | -0.6032 | Yes | ||
| 45 | PABPC1 | 2650180 2690253 6020632 1990270 | 17644 | -1.920 | -0.5840 | Yes | ||
| 46 | KIN | 6550014 | 17779 | -2.124 | -0.5692 | Yes | ||
| 47 | KHDRBS1 | 1240403 6040040 | 17875 | -2.247 | -0.5511 | Yes | ||
| 48 | SRPK1 | 450110 | 17883 | -2.264 | -0.5280 | Yes | ||
| 49 | DHX38 | 780243 | 17977 | -2.415 | -0.5080 | Yes | ||
| 50 | PAIP1 | 3870576 | 18053 | -2.557 | -0.4856 | Yes | ||
| 51 | CSTF2 | 6040463 | 18125 | -2.727 | -0.4612 | Yes | ||
| 52 | SF3A3 | 6660603 | 18208 | -2.919 | -0.4354 | Yes | ||
| 53 | SFRS6 | 60224 | 18213 | -2.933 | -0.4053 | Yes | ||
| 54 | CDC2L2 | 1400671 5290168 | 18214 | -2.935 | -0.3749 | Yes | ||
| 55 | GRSF1 | 2100184 | 18310 | -3.204 | -0.3468 | Yes | ||
| 56 | SFRS2IP | 730687 1500373 | 18315 | -3.224 | -0.3137 | Yes | ||
| 57 | SFPQ | 4760110 | 18381 | -3.477 | -0.2812 | Yes | ||
| 58 | SRPK2 | 6380341 | 18529 | -4.282 | -0.2448 | Yes | ||
| 59 | DDX20 | 3290348 | 18537 | -4.358 | -0.2000 | Yes | ||
| 60 | SPOP | 450035 | 18556 | -4.589 | -0.1535 | Yes | ||
| 61 | DHX15 | 870632 | 18572 | -4.807 | -0.1045 | Yes | ||
| 62 | SFRS1 | 2360440 | 18577 | -4.846 | -0.0546 | Yes | ||
| 63 | GSPT1 | 5420050 | 18598 | -5.469 | 0.0010 | Yes |

