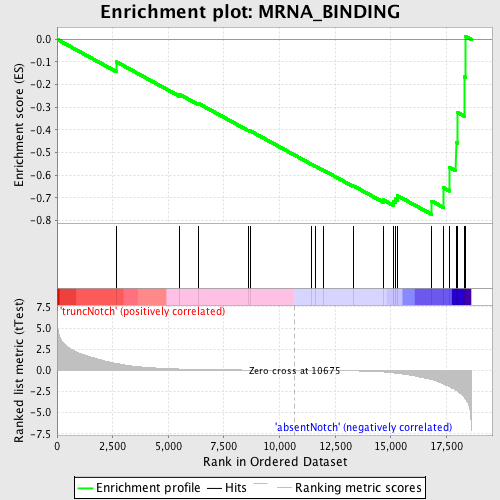
Profile of the Running ES Score & Positions of GeneSet Members on the Rank Ordered List
| Dataset | Set_03_absentNotch_versus_truncNotch.phenotype_absentNotch_versus_truncNotch.cls #truncNotch_versus_absentNotch |
| Phenotype | phenotype_absentNotch_versus_truncNotch.cls#truncNotch_versus_absentNotch |
| Upregulated in class | absentNotch |
| GeneSet | MRNA_BINDING |
| Enrichment Score (ES) | -0.7734685 |
| Normalized Enrichment Score (NES) | -1.6726679 |
| Nominal p-value | 0.0021551724 |
| FDR q-value | 0.2631725 |
| FWER p-Value | 0.675 |
| PROBE | DESCRIPTION (from dataset) | GENE SYMBOL | GENE_TITLE | RANK IN GENE LIST | RANK METRIC SCORE | RUNNING ES | CORE ENRICHMENT | |
|---|---|---|---|---|---|---|---|---|
| 1 | ZFP36 | 2030605 | 2673 | 0.812 | -0.0997 | No | ||
| 2 | ELAVL2 | 360181 | 5502 | 0.159 | -0.2431 | No | ||
| 3 | PARN | 3840129 | 6332 | 0.106 | -0.2819 | No | ||
| 4 | FMR1 | 5050075 | 8594 | 0.037 | -0.4015 | No | ||
| 5 | SSB | 460286 3140717 | 8687 | 0.035 | -0.4045 | No | ||
| 6 | AUH | 5570152 | 11416 | -0.013 | -0.5505 | No | ||
| 7 | SLBP | 6220601 | 11603 | -0.016 | -0.5596 | No | ||
| 8 | TIA1 | 4670373 | 11975 | -0.024 | -0.5783 | No | ||
| 9 | PABPC4 | 1990170 6760270 5390138 | 13329 | -0.063 | -0.6476 | No | ||
| 10 | EIF4A3 | 3440538 | 14654 | -0.185 | -0.7087 | No | ||
| 11 | ZFP36L1 | 2510138 4120048 | 15103 | -0.292 | -0.7169 | Yes | ||
| 12 | RPL35 | 6940070 | 15206 | -0.325 | -0.7048 | Yes | ||
| 13 | ELAVL4 | 50735 3360086 5220167 | 15306 | -0.352 | -0.6910 | Yes | ||
| 14 | CPSF1 | 6290064 | 16841 | -1.090 | -0.7143 | Yes | ||
| 15 | PURB | 5360138 | 17367 | -1.611 | -0.6551 | Yes | ||
| 16 | PABPC1 | 2650180 2690253 6020632 1990270 | 17644 | -1.920 | -0.5657 | Yes | ||
| 17 | EIF4A1 | 1990341 2810300 | 17929 | -2.341 | -0.4540 | Yes | ||
| 18 | HNRPDL | 1050102 1090181 5360471 | 18013 | -2.480 | -0.3238 | Yes | ||
| 19 | GRSF1 | 2100184 | 18310 | -3.204 | -0.1658 | Yes | ||
| 20 | HNRPAB | 540504 | 18350 | -3.358 | 0.0143 | Yes |

