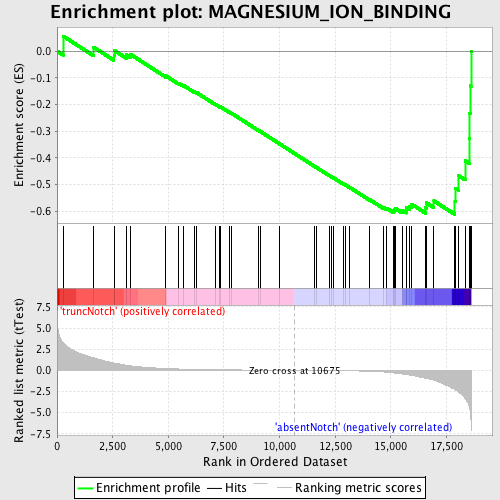
Profile of the Running ES Score & Positions of GeneSet Members on the Rank Ordered List
| Dataset | Set_03_absentNotch_versus_truncNotch.phenotype_absentNotch_versus_truncNotch.cls #truncNotch_versus_absentNotch |
| Phenotype | phenotype_absentNotch_versus_truncNotch.cls#truncNotch_versus_absentNotch |
| Upregulated in class | absentNotch |
| GeneSet | MAGNESIUM_ION_BINDING |
| Enrichment Score (ES) | -0.6122176 |
| Normalized Enrichment Score (NES) | -1.5579153 |
| Nominal p-value | 0.0070093456 |
| FDR q-value | 0.65268886 |
| FWER p-Value | 0.996 |
| PROBE | DESCRIPTION (from dataset) | GENE SYMBOL | GENE_TITLE | RANK IN GENE LIST | RANK METRIC SCORE | RUNNING ES | CORE ENRICHMENT | |
|---|---|---|---|---|---|---|---|---|
| 1 | PINK1 | 380044 580577 | 271 | 3.282 | 0.0565 | No | ||
| 2 | MSH6 | 4480064 6520093 | 1649 | 1.483 | 0.0145 | No | ||
| 3 | MAST1 | 6940215 | 2557 | 0.872 | -0.0155 | No | ||
| 4 | TSSK6 | 2190136 | 2568 | 0.868 | 0.0028 | No | ||
| 5 | CDC42BPB | 6350037 | 3106 | 0.605 | -0.0131 | No | ||
| 6 | BRSK2 | 4050292 | 3305 | 0.536 | -0.0121 | No | ||
| 7 | ERN2 | 7000411 | 4891 | 0.219 | -0.0927 | No | ||
| 8 | SNF1LK2 | 4280739 2480463 | 5455 | 0.163 | -0.1195 | No | ||
| 9 | ERN1 | 2360403 | 5686 | 0.146 | -0.1287 | No | ||
| 10 | TSSK2 | 5220324 | 6158 | 0.115 | -0.1516 | No | ||
| 11 | SPHK1 | 2470113 4230398 6220397 | 6280 | 0.109 | -0.1558 | No | ||
| 12 | TSSK3 | 1740673 | 7128 | 0.074 | -0.1998 | No | ||
| 13 | MAPK12 | 450022 1340717 7050484 | 7315 | 0.068 | -0.2083 | No | ||
| 14 | TSSK1A | 4480537 | 7321 | 0.067 | -0.2072 | No | ||
| 15 | TGM3 | 840576 | 7730 | 0.056 | -0.2279 | No | ||
| 16 | MAP3K5 | 6020041 6380162 | 7840 | 0.054 | -0.2326 | No | ||
| 17 | STK38 | 7100114 | 9033 | 0.028 | -0.2962 | No | ||
| 18 | MAP2K7 | 2260086 | 9136 | 0.026 | -0.3011 | No | ||
| 19 | IRAK3 | 4050102 | 10015 | 0.011 | -0.3482 | No | ||
| 20 | SNF1LK | 6110403 | 11552 | -0.016 | -0.4306 | No | ||
| 21 | NLRC4 | 5570332 | 11670 | -0.018 | -0.4365 | No | ||
| 22 | GCLC | 2810731 | 12246 | -0.030 | -0.4668 | No | ||
| 23 | STK38L | 840133 | 12351 | -0.032 | -0.4717 | No | ||
| 24 | STK11 | 6550278 | 12401 | -0.033 | -0.4736 | No | ||
| 25 | ABL2 | 580021 | 12882 | -0.047 | -0.4984 | No | ||
| 26 | CDC42BPA | 840671 | 12955 | -0.050 | -0.5012 | No | ||
| 27 | MOV10L1 | 4050411 | 13126 | -0.055 | -0.5092 | No | ||
| 28 | MARK1 | 450484 | 14055 | -0.108 | -0.5569 | No | ||
| 29 | ABL1 | 1050593 2030050 4010114 | 14663 | -0.186 | -0.5855 | No | ||
| 30 | NEK6 | 3360687 | 14798 | -0.213 | -0.5881 | No | ||
| 31 | NLK | 2030010 2450041 | 15117 | -0.295 | -0.5988 | Yes | ||
| 32 | STK3 | 7100427 | 15154 | -0.306 | -0.5941 | Yes | ||
| 33 | MAP3K6 | 6400390 | 15196 | -0.320 | -0.5894 | Yes | ||
| 34 | MARK2 | 7210608 | 15510 | -0.424 | -0.5971 | Yes | ||
| 35 | MSH2 | 6180273 | 15689 | -0.488 | -0.5961 | Yes | ||
| 36 | MAST2 | 6200348 | 15711 | -0.496 | -0.5865 | Yes | ||
| 37 | SNRK | 630021 2030731 6350017 | 15848 | -0.554 | -0.5818 | Yes | ||
| 38 | DYRK3 | 1090014 | 15932 | -0.592 | -0.5735 | Yes | ||
| 39 | HPRT1 | 1690398 4920619 6350170 | 16563 | -0.937 | -0.5871 | Yes | ||
| 40 | MTHFD2 | 3800411 | 16587 | -0.949 | -0.5677 | Yes | ||
| 41 | NME1 | 770014 | 16938 | -1.164 | -0.5614 | Yes | ||
| 42 | SRPK1 | 450110 | 17883 | -2.264 | -0.5632 | Yes | ||
| 43 | TESC | 6550273 | 17910 | -2.309 | -0.5146 | Yes | ||
| 44 | ICK | 1580746 3140021 | 18048 | -2.543 | -0.4669 | Yes | ||
| 45 | CERK | 110397 670168 | 18341 | -3.322 | -0.4106 | Yes | ||
| 46 | SRPK2 | 6380341 | 18529 | -4.282 | -0.3279 | Yes | ||
| 47 | FIGNL1 | 6860390 | 18547 | -4.471 | -0.2320 | Yes | ||
| 48 | STK4 | 2640152 | 18573 | -4.814 | -0.1291 | Yes | ||
| 49 | PRKACB | 4210170 | 18607 | -6.062 | 0.0005 | Yes |

