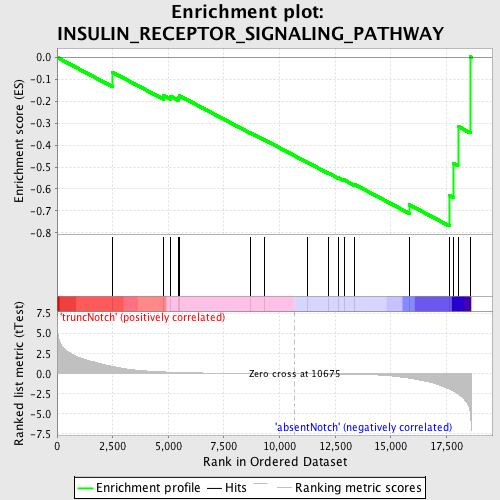
Profile of the Running ES Score & Positions of GeneSet Members on the Rank Ordered List
| Dataset | Set_03_absentNotch_versus_truncNotch.phenotype_absentNotch_versus_truncNotch.cls #truncNotch_versus_absentNotch |
| Phenotype | phenotype_absentNotch_versus_truncNotch.cls#truncNotch_versus_absentNotch |
| Upregulated in class | absentNotch |
| GeneSet | INSULIN_RECEPTOR_SIGNALING_PATHWAY |
| Enrichment Score (ES) | -0.7690023 |
| Normalized Enrichment Score (NES) | -1.5934981 |
| Nominal p-value | 0.015801355 |
| FDR q-value | 0.4981829 |
| FWER p-Value | 0.979 |
| PROBE | DESCRIPTION (from dataset) | GENE SYMBOL | GENE_TITLE | RANK IN GENE LIST | RANK METRIC SCORE | RUNNING ES | CORE ENRICHMENT | |
|---|---|---|---|---|---|---|---|---|
| 1 | IGF2 | 6510020 | 2497 | 0.911 | -0.0681 | No | ||
| 2 | BCAR1 | 1340215 | 4773 | 0.233 | -0.1736 | No | ||
| 3 | SOCS1 | 730139 | 5086 | 0.195 | -0.1762 | No | ||
| 4 | SNF1LK2 | 4280739 2480463 | 5455 | 0.163 | -0.1842 | No | ||
| 5 | INSR | 1190504 | 5480 | 0.161 | -0.1738 | No | ||
| 6 | PIK3R1 | 4730671 | 8679 | 0.035 | -0.3432 | No | ||
| 7 | IRS1 | 1190204 | 9325 | 0.023 | -0.3762 | No | ||
| 8 | AKT1 | 5290746 | 11234 | -0.010 | -0.4781 | No | ||
| 9 | GRB10 | 6980082 | 12216 | -0.029 | -0.5287 | No | ||
| 10 | FOXC2 | 4150041 | 12642 | -0.040 | -0.5486 | No | ||
| 11 | IGF1R | 3360494 | 12897 | -0.048 | -0.5588 | No | ||
| 12 | BAIAP2 | 460347 4730600 | 13380 | -0.065 | -0.5800 | No | ||
| 13 | GAB1 | 2970156 | 15831 | -0.546 | -0.6721 | Yes | ||
| 14 | GRB2 | 6650398 | 17634 | -1.909 | -0.6305 | Yes | ||
| 15 | PDPK1 | 6650168 | 17801 | -2.154 | -0.4832 | Yes | ||
| 16 | PIK3R3 | 1770333 | 18020 | -2.488 | -0.3145 | Yes | ||
| 17 | AP3S1 | 5570044 | 18568 | -4.776 | 0.0026 | Yes |

