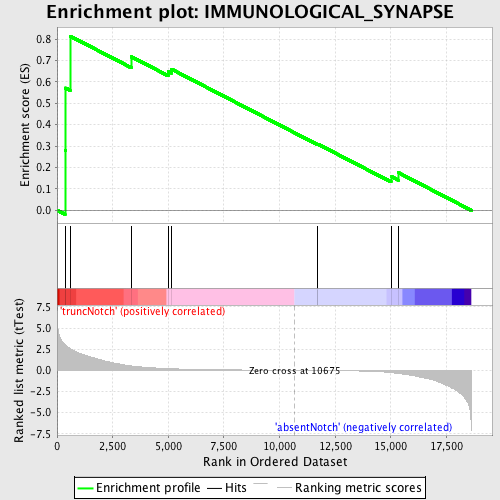
Profile of the Running ES Score & Positions of GeneSet Members on the Rank Ordered List
| Dataset | Set_03_absentNotch_versus_truncNotch.phenotype_absentNotch_versus_truncNotch.cls #truncNotch_versus_absentNotch |
| Phenotype | phenotype_absentNotch_versus_truncNotch.cls#truncNotch_versus_absentNotch |
| Upregulated in class | truncNotch |
| GeneSet | IMMUNOLOGICAL_SYNAPSE |
| Enrichment Score (ES) | 0.8134855 |
| Normalized Enrichment Score (NES) | 1.4429878 |
| Nominal p-value | 0.028790787 |
| FDR q-value | 0.95334905 |
| FWER p-Value | 1.0 |
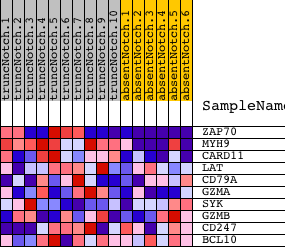
| PROBE | DESCRIPTION (from dataset) | GENE SYMBOL | GENE_TITLE | RANK IN GENE LIST | RANK METRIC SCORE | RUNNING ES | CORE ENRICHMENT | |
|---|---|---|---|---|---|---|---|---|
| 1 | ZAP70 | 1410494 2260504 | 358 | 3.049 | 0.2791 | Yes | ||
| 2 | MYH9 | 3120091 4850292 | 374 | 2.994 | 0.5713 | Yes | ||
| 3 | CARD11 | 70338 | 586 | 2.591 | 0.8135 | Yes | ||
| 4 | LAT | 3170025 | 3335 | 0.527 | 0.7173 | No | ||
| 5 | CD79A | 3450563 | 4993 | 0.208 | 0.6486 | No | ||
| 6 | GZMA | 3390315 | 5137 | 0.189 | 0.6595 | No | ||
| 7 | SYK | 6940133 | 11709 | -0.018 | 0.3081 | No | ||
| 8 | GZMB | 380066 | 11721 | -0.018 | 0.3093 | No | ||
| 9 | CD247 | 3800725 5720136 | 15011 | -0.264 | 0.1584 | No | ||
| 10 | BCL10 | 2360397 | 15331 | -0.361 | 0.1765 | No |