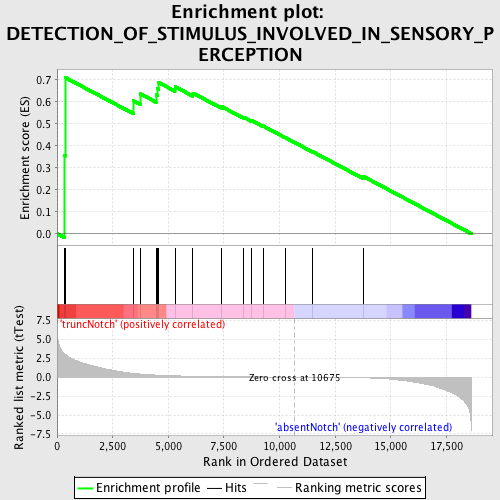
Profile of the Running ES Score & Positions of GeneSet Members on the Rank Ordered List
| Dataset | Set_03_absentNotch_versus_truncNotch.phenotype_absentNotch_versus_truncNotch.cls #truncNotch_versus_absentNotch |
| Phenotype | phenotype_absentNotch_versus_truncNotch.cls#truncNotch_versus_absentNotch |
| Upregulated in class | truncNotch |
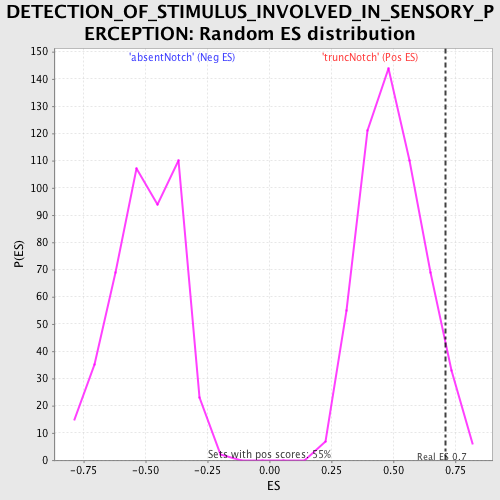
| GeneSet | DETECTION_OF_STIMULUS_INVOLVED_IN_SENSORY_PERCEPTION |
| Enrichment Score (ES) | 0.7105302 |
| Normalized Enrichment Score (NES) | 1.4280694 |
| Nominal p-value | 0.049541283 |
| FDR q-value | 1.0 |
| FWER p-Value | 1.0 |
| PROBE | DESCRIPTION (from dataset) | GENE SYMBOL | GENE_TITLE | RANK IN GENE LIST | RANK METRIC SCORE | RUNNING ES | CORE ENRICHMENT | |
|---|---|---|---|---|---|---|---|---|
| 1 | PITPNM1 | 4540528 | 316 | 3.140 | 0.3565 | Yes | ||
| 2 | UNC119 | 360372 | 370 | 3.000 | 0.7105 | Yes | ||
| 3 | SAG | 6550603 | 3421 | 0.498 | 0.6058 | No | ||
| 4 | CACNA1F | 2360605 3390450 | 3751 | 0.404 | 0.6363 | No | ||
| 5 | PDE6B | 2480187 | 4448 | 0.276 | 0.6316 | No | ||
| 6 | OPN4 | 5670091 | 4512 | 0.267 | 0.6600 | No | ||
| 7 | RHO | 4280398 | 4562 | 0.258 | 0.6881 | No | ||
| 8 | PDC | 3140400 3780184 | 5299 | 0.174 | 0.6693 | No | ||
| 9 | ABCA4 | 2370064 3940711 | 6107 | 0.118 | 0.6399 | No | ||
| 10 | RTP3 | 2260176 | 7401 | 0.065 | 0.5781 | No | ||
| 11 | TRPC3 | 840064 | 8372 | 0.042 | 0.5309 | No | ||
| 12 | TAS1R3 | 360136 | 8732 | 0.034 | 0.5157 | No | ||
| 13 | GRK1 | 1410112 | 9256 | 0.024 | 0.4904 | No | ||
| 14 | NR2E3 | 7050465 | 10269 | 0.007 | 0.4368 | No | ||
| 15 | TAS1R2 | 4850072 | 11493 | -0.015 | 0.3728 | No | ||
| 16 | OPN1SW | 6420377 | 13753 | -0.085 | 0.2614 | No |