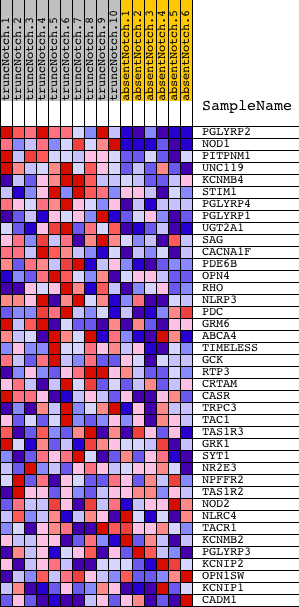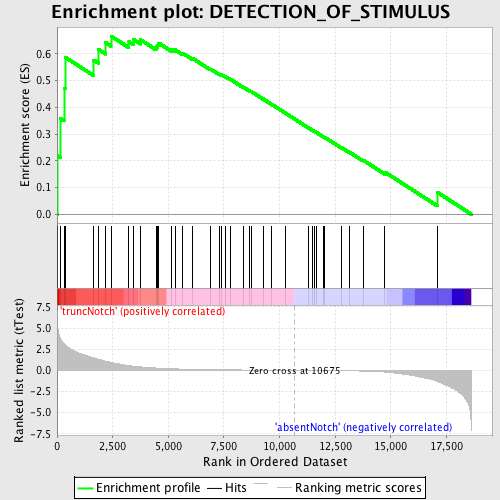
Profile of the Running ES Score & Positions of GeneSet Members on the Rank Ordered List
| Dataset | Set_03_absentNotch_versus_truncNotch.phenotype_absentNotch_versus_truncNotch.cls #truncNotch_versus_absentNotch |
| Phenotype | phenotype_absentNotch_versus_truncNotch.cls#truncNotch_versus_absentNotch |
| Upregulated in class | truncNotch |
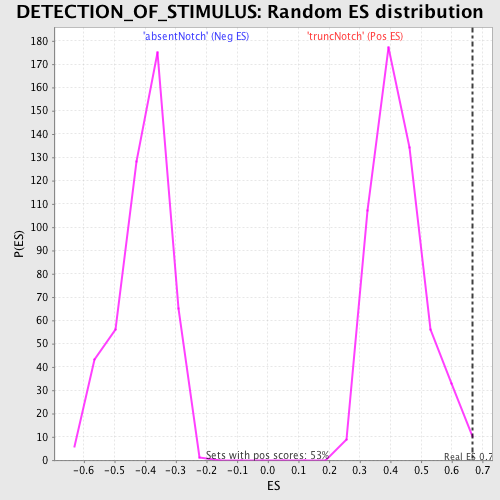
| GeneSet | DETECTION_OF_STIMULUS |
| Enrichment Score (ES) | 0.666409 |
| Normalized Enrichment Score (NES) | 1.5579724 |
| Nominal p-value | 0.0057034222 |
| FDR q-value | 1.0 |
| FWER p-Value | 0.992 |
| PROBE | DESCRIPTION (from dataset) | GENE SYMBOL | GENE_TITLE | RANK IN GENE LIST | RANK METRIC SCORE | RUNNING ES | CORE ENRICHMENT | |
|---|---|---|---|---|---|---|---|---|
| 1 | PGLYRP2 | 2340086 | 18 | 5.603 | 0.2189 | Yes | ||
| 2 | NOD1 | 2360368 | 155 | 3.719 | 0.3576 | Yes | ||
| 3 | PITPNM1 | 4540528 | 316 | 3.140 | 0.4722 | Yes | ||
| 4 | UNC119 | 360372 | 370 | 3.000 | 0.5871 | Yes | ||
| 5 | KCNMB4 | 3290347 | 1643 | 1.485 | 0.5769 | Yes | ||
| 6 | STIM1 | 6380138 | 1854 | 1.311 | 0.6170 | Yes | ||
| 7 | PGLYRP4 | 3780411 | 2184 | 1.084 | 0.6418 | Yes | ||
| 8 | PGLYRP1 | 6760242 | 2423 | 0.952 | 0.6664 | Yes | ||
| 9 | UGT2A1 | 5080338 | 3228 | 0.564 | 0.6453 | No | ||
| 10 | SAG | 6550603 | 3421 | 0.498 | 0.6545 | No | ||
| 11 | CACNA1F | 2360605 3390450 | 3751 | 0.404 | 0.6526 | No | ||
| 12 | PDE6B | 2480187 | 4448 | 0.276 | 0.6260 | No | ||
| 13 | OPN4 | 5670091 | 4512 | 0.267 | 0.6331 | No | ||
| 14 | RHO | 4280398 | 4562 | 0.258 | 0.6406 | No | ||
| 15 | NLRP3 | 1980064 4010180 | 5161 | 0.187 | 0.6157 | No | ||
| 16 | PDC | 3140400 3780184 | 5299 | 0.174 | 0.6152 | No | ||
| 17 | GRM6 | 2030398 | 5649 | 0.149 | 0.6022 | No | ||
| 18 | ABCA4 | 2370064 3940711 | 6107 | 0.118 | 0.5823 | No | ||
| 19 | TIMELESS | 3710315 | 6892 | 0.082 | 0.5433 | No | ||
| 20 | GCK | 2370273 | 7296 | 0.069 | 0.5243 | No | ||
| 21 | RTP3 | 2260176 | 7401 | 0.065 | 0.5212 | No | ||
| 22 | CRTAM | 4480110 | 7552 | 0.060 | 0.5155 | No | ||
| 23 | CASR | 610504 | 7781 | 0.055 | 0.5054 | No | ||
| 24 | TRPC3 | 840064 | 8372 | 0.042 | 0.4753 | No | ||
| 25 | TAC1 | 7000195 380706 | 8632 | 0.037 | 0.4628 | No | ||
| 26 | TAS1R3 | 360136 | 8732 | 0.034 | 0.4588 | No | ||
| 27 | GRK1 | 1410112 | 9256 | 0.024 | 0.4316 | No | ||
| 28 | SYT1 | 840364 | 9642 | 0.017 | 0.4115 | No | ||
| 29 | NR2E3 | 7050465 | 10269 | 0.007 | 0.3781 | No | ||
| 30 | NPFFR2 | 2320273 | 11301 | -0.011 | 0.3230 | No | ||
| 31 | TAS1R2 | 4850072 | 11493 | -0.015 | 0.3133 | No | ||
| 32 | NOD2 | 2510050 | 11583 | -0.016 | 0.3091 | No | ||
| 33 | NLRC4 | 5570332 | 11670 | -0.018 | 0.3052 | No | ||
| 34 | TACR1 | 70358 3840411 | 11957 | -0.024 | 0.2907 | No | ||
| 35 | KCNMB2 | 3780128 4760136 | 12022 | -0.025 | 0.2883 | No | ||
| 36 | PGLYRP3 | 6350403 | 12779 | -0.044 | 0.2493 | No | ||
| 37 | KCNIP2 | 60088 1780324 | 13132 | -0.055 | 0.2325 | No | ||
| 38 | OPN1SW | 6420377 | 13753 | -0.085 | 0.2025 | No | ||
| 39 | KCNIP1 | 6370736 | 14737 | -0.202 | 0.1575 | No | ||
| 40 | CADM1 | 6620128 | 17085 | -1.306 | 0.0824 | No |