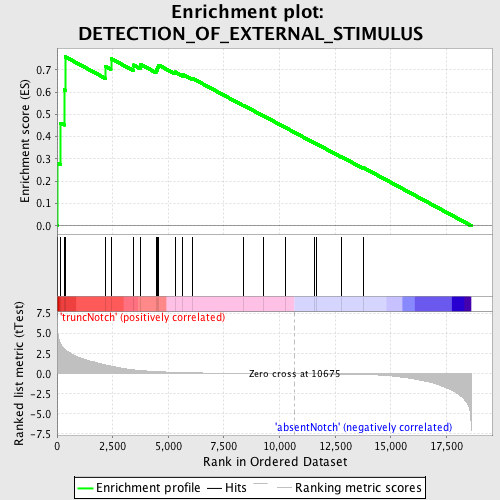
Profile of the Running ES Score & Positions of GeneSet Members on the Rank Ordered List
| Dataset | Set_03_absentNotch_versus_truncNotch.phenotype_absentNotch_versus_truncNotch.cls #truncNotch_versus_absentNotch |
| Phenotype | phenotype_absentNotch_versus_truncNotch.cls#truncNotch_versus_absentNotch |
| Upregulated in class | truncNotch |
| GeneSet | DETECTION_OF_EXTERNAL_STIMULUS |
| Enrichment Score (ES) | 0.7581297 |
| Normalized Enrichment Score (NES) | 1.6028603 |
| Nominal p-value | 0.01058201 |
| FDR q-value | 1.0 |
| FWER p-Value | 0.898 |
| PROBE | DESCRIPTION (from dataset) | GENE SYMBOL | GENE_TITLE | RANK IN GENE LIST | RANK METRIC SCORE | RUNNING ES | CORE ENRICHMENT | |
|---|---|---|---|---|---|---|---|---|
| 1 | PGLYRP2 | 2340086 | 18 | 5.603 | 0.2809 | Yes | ||
| 2 | NOD1 | 2360368 | 155 | 3.719 | 0.4607 | Yes | ||
| 3 | PITPNM1 | 4540528 | 316 | 3.140 | 0.6101 | Yes | ||
| 4 | UNC119 | 360372 | 370 | 3.000 | 0.7581 | Yes | ||
| 5 | PGLYRP4 | 3780411 | 2184 | 1.084 | 0.7151 | No | ||
| 6 | PGLYRP1 | 6760242 | 2423 | 0.952 | 0.7503 | No | ||
| 7 | SAG | 6550603 | 3421 | 0.498 | 0.7217 | No | ||
| 8 | CACNA1F | 2360605 3390450 | 3751 | 0.404 | 0.7244 | No | ||
| 9 | PDE6B | 2480187 | 4448 | 0.276 | 0.7008 | No | ||
| 10 | OPN4 | 5670091 | 4512 | 0.267 | 0.7108 | No | ||
| 11 | RHO | 4280398 | 4562 | 0.258 | 0.7212 | No | ||
| 12 | PDC | 3140400 3780184 | 5299 | 0.174 | 0.6904 | No | ||
| 13 | GRM6 | 2030398 | 5649 | 0.149 | 0.6791 | No | ||
| 14 | ABCA4 | 2370064 3940711 | 6107 | 0.118 | 0.6605 | No | ||
| 15 | TRPC3 | 840064 | 8372 | 0.042 | 0.5408 | No | ||
| 16 | GRK1 | 1410112 | 9256 | 0.024 | 0.4945 | No | ||
| 17 | NR2E3 | 7050465 | 10269 | 0.007 | 0.4405 | No | ||
| 18 | NOD2 | 2510050 | 11583 | -0.016 | 0.3707 | No | ||
| 19 | NLRC4 | 5570332 | 11670 | -0.018 | 0.3669 | No | ||
| 20 | PGLYRP3 | 6350403 | 12779 | -0.044 | 0.3096 | No | ||
| 21 | OPN1SW | 6420377 | 13753 | -0.085 | 0.2615 | No |

