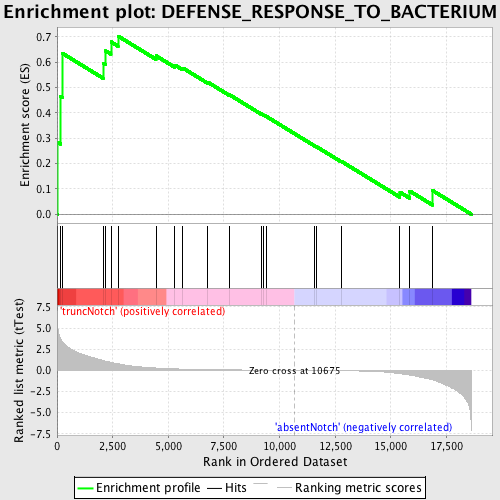
Profile of the Running ES Score & Positions of GeneSet Members on the Rank Ordered List
| Dataset | Set_03_absentNotch_versus_truncNotch.phenotype_absentNotch_versus_truncNotch.cls #truncNotch_versus_absentNotch |
| Phenotype | phenotype_absentNotch_versus_truncNotch.cls#truncNotch_versus_absentNotch |
| Upregulated in class | truncNotch |
| GeneSet | DEFENSE_RESPONSE_TO_BACTERIUM |
| Enrichment Score (ES) | 0.70250976 |
| Normalized Enrichment Score (NES) | 1.4646405 |
| Nominal p-value | 0.04609929 |
| FDR q-value | 0.9670179 |
| FWER p-Value | 1.0 |
| PROBE | DESCRIPTION (from dataset) | GENE SYMBOL | GENE_TITLE | RANK IN GENE LIST | RANK METRIC SCORE | RUNNING ES | CORE ENRICHMENT | |
|---|---|---|---|---|---|---|---|---|
| 1 | PGLYRP2 | 2340086 | 18 | 5.603 | 0.2840 | Yes | ||
| 2 | NOD1 | 2360368 | 155 | 3.719 | 0.4658 | Yes | ||
| 3 | SPN | 3520338 3870671 | 232 | 3.408 | 0.6350 | Yes | ||
| 4 | CAMP | 6290735 | 2069 | 1.160 | 0.5953 | Yes | ||
| 5 | PGLYRP4 | 3780411 | 2184 | 1.084 | 0.6442 | Yes | ||
| 6 | PGLYRP1 | 6760242 | 2423 | 0.952 | 0.6799 | Yes | ||
| 7 | DEFB127 | 520564 | 2741 | 0.781 | 0.7025 | Yes | ||
| 8 | DMBT1 | 7050270 | 4446 | 0.276 | 0.6249 | No | ||
| 9 | SPACA3 | 1850161 | 5295 | 0.175 | 0.5882 | No | ||
| 10 | STAB1 | 5390707 | 5655 | 0.148 | 0.5764 | No | ||
| 11 | DEFB103A | 50014 | 6768 | 0.086 | 0.5210 | No | ||
| 12 | STAB2 | 4810452 | 7750 | 0.056 | 0.4711 | No | ||
| 13 | LALBA | 6940685 | 9170 | 0.025 | 0.3961 | No | ||
| 14 | WFDC12 | 6980647 | 9290 | 0.023 | 0.3909 | No | ||
| 15 | TLR3 | 6760451 | 9403 | 0.021 | 0.3859 | No | ||
| 16 | NOD2 | 2510050 | 11583 | -0.016 | 0.2696 | No | ||
| 17 | NLRC4 | 5570332 | 11670 | -0.018 | 0.2658 | No | ||
| 18 | PGLYRP3 | 6350403 | 12779 | -0.044 | 0.2085 | No | ||
| 19 | IL12A | 7100551 | 15410 | -0.389 | 0.0868 | No | ||
| 20 | TLR6 | 510102 3390148 | 15847 | -0.554 | 0.0915 | No | ||
| 21 | CFP | 2100619 | 16878 | -1.127 | 0.0935 | No |

