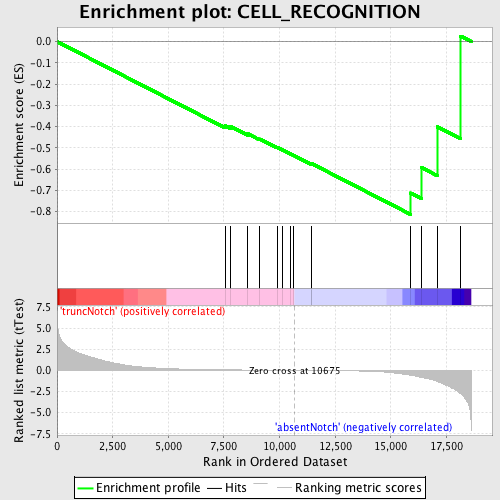
Profile of the Running ES Score & Positions of GeneSet Members on the Rank Ordered List
| Dataset | Set_03_absentNotch_versus_truncNotch.phenotype_absentNotch_versus_truncNotch.cls #truncNotch_versus_absentNotch |
| Phenotype | phenotype_absentNotch_versus_truncNotch.cls#truncNotch_versus_absentNotch |
| Upregulated in class | absentNotch |
| GeneSet | CELL_RECOGNITION |
| Enrichment Score (ES) | -0.81324476 |
| Normalized Enrichment Score (NES) | -1.6320937 |
| Nominal p-value | 0.0043668123 |
| FDR q-value | 0.3659141 |
| FWER p-Value | 0.885 |
| PROBE | DESCRIPTION (from dataset) | GENE SYMBOL | GENE_TITLE | RANK IN GENE LIST | RANK METRIC SCORE | RUNNING ES | CORE ENRICHMENT | |
|---|---|---|---|---|---|---|---|---|
| 1 | CRTAM | 4480110 | 7552 | 0.060 | -0.3954 | No | ||
| 2 | CNTN4 | 1780300 5570577 6370019 | 7786 | 0.055 | -0.3982 | No | ||
| 3 | CLEC7A | 1990121 3450736 3800064 4610035 | 8567 | 0.038 | -0.4334 | No | ||
| 4 | COLEC12 | 2690717 4590086 | 9113 | 0.027 | -0.4580 | No | ||
| 5 | PCDH12 | 5340044 | 9894 | 0.013 | -0.4977 | No | ||
| 6 | HNT | 6450731 | 10146 | 0.009 | -0.5097 | No | ||
| 7 | ZP2 | 1580408 | 10509 | 0.003 | -0.5287 | No | ||
| 8 | SLIT2 | 1940037 | 10629 | 0.001 | -0.5349 | No | ||
| 9 | VCAN | 3290017 5910053 6940014 | 11422 | -0.013 | -0.5752 | No | ||
| 10 | SPAM1 | 4480398 | 11441 | -0.013 | -0.5738 | No | ||
| 11 | AMIGO1 | 6180215 | 15896 | -0.575 | -0.7121 | Yes | ||
| 12 | CDK5R1 | 3870161 | 16378 | -0.826 | -0.5927 | Yes | ||
| 13 | CADM1 | 6620128 | 17085 | -1.306 | -0.4008 | Yes | ||
| 14 | PECAM1 | 4810139 | 18134 | -2.745 | 0.0259 | Yes |