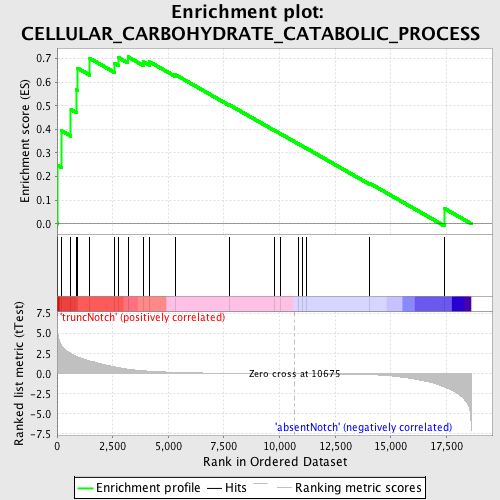
Profile of the Running ES Score & Positions of GeneSet Members on the Rank Ordered List
| Dataset | Set_03_absentNotch_versus_truncNotch.phenotype_absentNotch_versus_truncNotch.cls #truncNotch_versus_absentNotch |
| Phenotype | phenotype_absentNotch_versus_truncNotch.cls#truncNotch_versus_absentNotch |
| Upregulated in class | truncNotch |
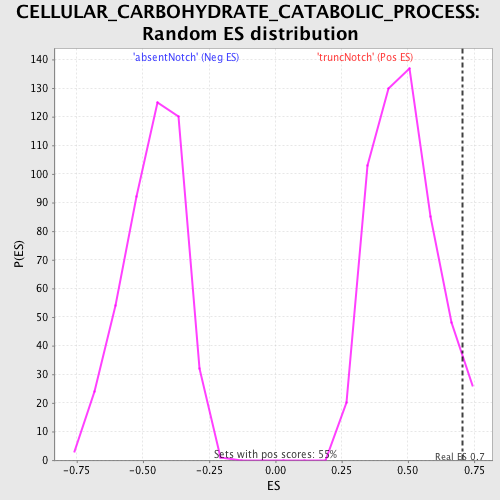
| GeneSet | CELLULAR_CARBOHYDRATE_CATABOLIC_PROCESS |
| Enrichment Score (ES) | 0.7070107 |
| Normalized Enrichment Score (NES) | 1.4527717 |
| Nominal p-value | 0.038251366 |
| FDR q-value | 0.9664523 |
| FWER p-Value | 1.0 |
| PROBE | DESCRIPTION (from dataset) | GENE SYMBOL | GENE_TITLE | RANK IN GENE LIST | RANK METRIC SCORE | RUNNING ES | CORE ENRICHMENT | |
|---|---|---|---|---|---|---|---|---|
| 1 | ALDOA | 6290672 | 20 | 5.593 | 0.2479 | Yes | ||
| 2 | PYGB | 2510731 | 203 | 3.499 | 0.3938 | Yes | ||
| 3 | GNPDA1 | 580181 5220112 840731 | 623 | 2.529 | 0.4839 | Yes | ||
| 4 | PGD | 6840048 | 875 | 2.174 | 0.5672 | Yes | ||
| 5 | PFKL | 6200167 | 911 | 2.120 | 0.6597 | Yes | ||
| 6 | GAA | 520035 | 1470 | 1.593 | 0.7006 | Yes | ||
| 7 | GBA2 | 2900372 | 2570 | 0.867 | 0.6801 | Yes | ||
| 8 | PGLS | 2120324 | 2770 | 0.766 | 0.7035 | Yes | ||
| 9 | HK1 | 4280402 | 3186 | 0.580 | 0.7070 | Yes | ||
| 10 | GAPDHS | 2690463 | 3886 | 0.376 | 0.6862 | No | ||
| 11 | TREH | 630079 | 4160 | 0.324 | 0.6859 | No | ||
| 12 | PFKFB1 | 2370128 | 5303 | 0.174 | 0.6323 | No | ||
| 13 | MIOX | 4810364 | 7735 | 0.056 | 0.5040 | No | ||
| 14 | HYAL4 | 1780020 | 9779 | 0.015 | 0.3948 | No | ||
| 15 | ALDOB | 4730324 | 10059 | 0.010 | 0.3803 | No | ||
| 16 | GNS | 3120458 | 10865 | -0.003 | 0.3371 | No | ||
| 17 | TKTL1 | 2810672 6760102 | 11051 | -0.006 | 0.3275 | No | ||
| 18 | CHIT1 | 7050347 | 11194 | -0.009 | 0.3202 | No | ||
| 19 | MGAM | 2510438 | 14030 | -0.106 | 0.1725 | No | ||
| 20 | PFKM | 1990156 5720168 | 17413 | -1.664 | 0.0647 | No |