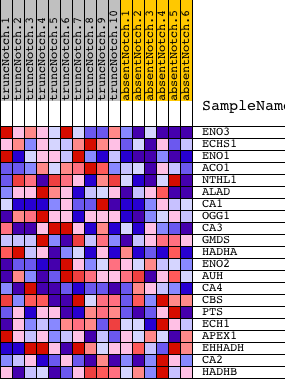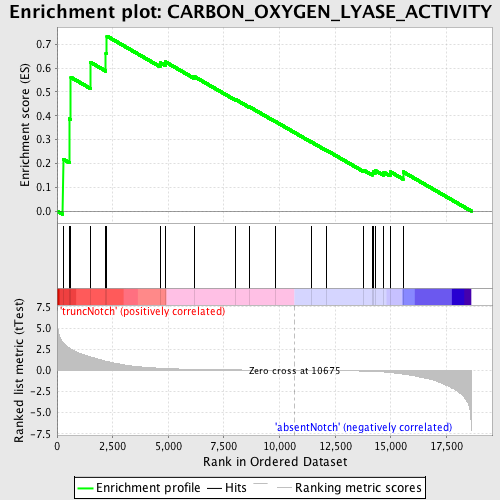
Profile of the Running ES Score & Positions of GeneSet Members on the Rank Ordered List
| Dataset | Set_03_absentNotch_versus_truncNotch.phenotype_absentNotch_versus_truncNotch.cls #truncNotch_versus_absentNotch |
| Phenotype | phenotype_absentNotch_versus_truncNotch.cls#truncNotch_versus_absentNotch |
| Upregulated in class | truncNotch |
| GeneSet | CARBON_OXYGEN_LYASE_ACTIVITY |
| Enrichment Score (ES) | 0.7343508 |
| Normalized Enrichment Score (NES) | 1.5105536 |
| Nominal p-value | 0.017953321 |
| FDR q-value | 0.8669957 |
| FWER p-Value | 1.0 |
| PROBE | DESCRIPTION (from dataset) | GENE SYMBOL | GENE_TITLE | RANK IN GENE LIST | RANK METRIC SCORE | RUNNING ES | CORE ENRICHMENT | |
|---|---|---|---|---|---|---|---|---|
| 1 | ENO3 | 5270136 | 264 | 3.305 | 0.2180 | Yes | ||
| 2 | ECHS1 | 2970184 | 560 | 2.631 | 0.3869 | Yes | ||
| 3 | ENO1 | 5340128 | 621 | 2.530 | 0.5614 | Yes | ||
| 4 | ACO1 | 50114 | 1499 | 1.570 | 0.6245 | Yes | ||
| 5 | NTHL1 | 4920148 | 2193 | 1.078 | 0.6630 | Yes | ||
| 6 | ALAD | 780576 | 2239 | 1.050 | 0.7344 | Yes | ||
| 7 | CA1 | 1340204 | 4631 | 0.250 | 0.6233 | No | ||
| 8 | OGG1 | 1940279 | 4862 | 0.223 | 0.6266 | No | ||
| 9 | CA3 | 870687 5890390 | 6154 | 0.116 | 0.5653 | No | ||
| 10 | GMDS | 1050519 | 8009 | 0.050 | 0.4691 | No | ||
| 11 | HADHA | 3190041 | 8642 | 0.036 | 0.4377 | No | ||
| 12 | ENO2 | 2320068 | 9796 | 0.015 | 0.3767 | No | ||
| 13 | AUH | 5570152 | 11416 | -0.013 | 0.2906 | No | ||
| 14 | CA4 | 130100 | 12124 | -0.027 | 0.2545 | No | ||
| 15 | CBS | 5420450 6660039 | 13789 | -0.087 | 0.1712 | No | ||
| 16 | PTS | 1500270 | 14160 | -0.117 | 0.1595 | No | ||
| 17 | ECH1 | 4120746 | 14208 | -0.122 | 0.1656 | No | ||
| 18 | APEX1 | 3190519 | 14319 | -0.136 | 0.1692 | No | ||
| 19 | EHHADH | 6200315 | 14685 | -0.191 | 0.1629 | No | ||
| 20 | CA2 | 1660113 1660600 | 14969 | -0.253 | 0.1655 | No | ||
| 21 | HADHB | 60064 2690670 | 15553 | -0.436 | 0.1647 | No |