Profile of the Running ES Score & Positions of GeneSet Members on the Rank Ordered List
| Dataset | Set_03_absentNotch_versus_truncNotch.phenotype_absentNotch_versus_truncNotch.cls #truncNotch_versus_absentNotch |
| Phenotype | phenotype_absentNotch_versus_truncNotch.cls#truncNotch_versus_absentNotch |
| Upregulated in class | absentNotch |
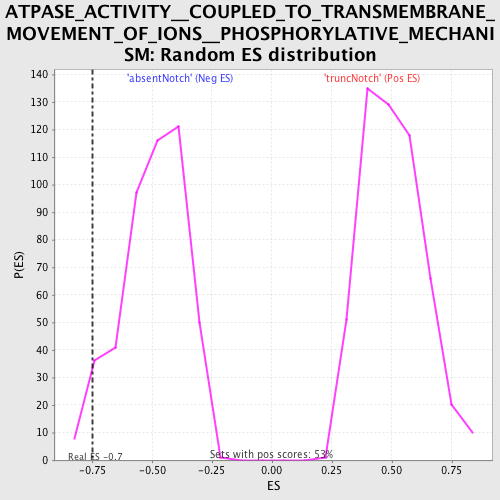
| GeneSet | ATPASE_ACTIVITY__COUPLED_TO_TRANSMEMBRANE_MOVEMENT_OF_IONS__PHOSPHORYLATIVE_MECHANISM |
| Enrichment Score (ES) | -0.7489983 |
| Normalized Enrichment Score (NES) | -1.514483 |
| Nominal p-value | 0.034042552 |
| FDR q-value | 0.6299859 |
| FWER p-Value | 1.0 |
| PROBE | DESCRIPTION (from dataset) | GENE SYMBOL | GENE_TITLE | RANK IN GENE LIST | RANK METRIC SCORE | RUNNING ES | CORE ENRICHMENT | |
|---|---|---|---|---|---|---|---|---|
| 1 | ATP2A1 | 110309 | 2749 | 0.778 | -0.0833 | No | ||
| 2 | ATP2C1 | 2630446 6520253 | 4121 | 0.331 | -0.1295 | No | ||
| 3 | ATP4B | 1740156 | 5217 | 0.181 | -0.1733 | No | ||
| 4 | ATP1A3 | 5690674 | 5630 | 0.150 | -0.1830 | No | ||
| 5 | ATP7B | 2060711 2470039 3140301 6650735 | 6152 | 0.116 | -0.2014 | No | ||
| 6 | ATP1A2 | 110278 | 6748 | 0.087 | -0.2262 | No | ||
| 7 | ABCB11 | 7040170 | 7061 | 0.076 | -0.2367 | No | ||
| 8 | ATP7A | 6550168 | 9773 | 0.015 | -0.3812 | No | ||
| 9 | ATP4A | 6220154 | 10500 | 0.003 | -0.4200 | No | ||
| 10 | ATP1B2 | 4480603 | 11802 | -0.020 | -0.4883 | No | ||
| 11 | ATP2B3 | 2260022 3780059 | 12534 | -0.037 | -0.5245 | No | ||
| 12 | FXYD2 | 1400280 2350719 3520184 7040377 | 14286 | -0.131 | -0.6077 | No | ||
| 13 | ATP1A1 | 5670451 | 16915 | -1.149 | -0.6536 | Yes | ||
| 14 | ATP2A3 | 130440 2190451 | 17262 | -1.495 | -0.5482 | Yes | ||
| 15 | ATP2A2 | 1090075 3990279 | 17677 | -1.987 | -0.4055 | Yes | ||
| 16 | ATP1B3 | 6040128 | 18128 | -2.730 | -0.2031 | Yes | ||
| 17 | ATP1B1 | 3130594 | 18138 | -2.762 | 0.0257 | Yes |