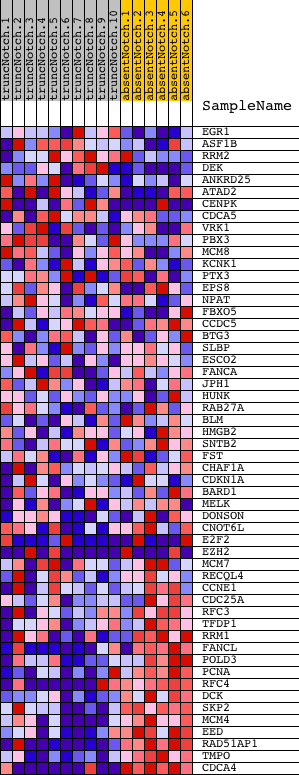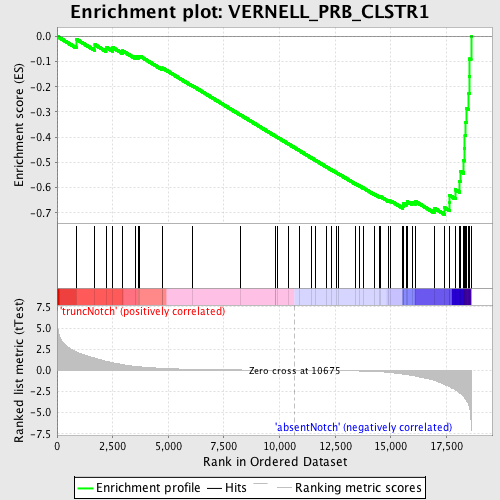
Profile of the Running ES Score & Positions of GeneSet Members on the Rank Ordered List
| Dataset | Set_03_absentNotch_versus_truncNotch.phenotype_absentNotch_versus_truncNotch.cls #truncNotch_versus_absentNotch |
| Phenotype | phenotype_absentNotch_versus_truncNotch.cls#truncNotch_versus_absentNotch |
| Upregulated in class | absentNotch |
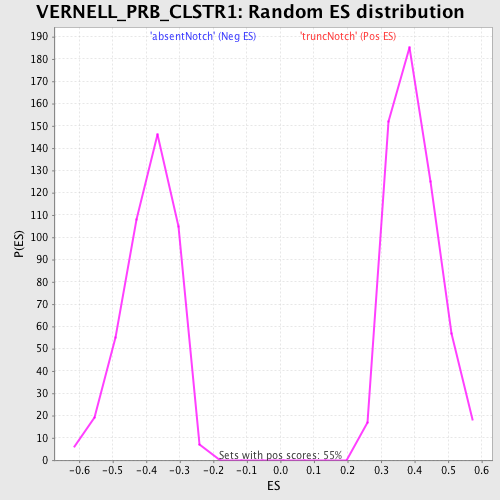
| GeneSet | VERNELL_PRB_CLSTR1 |
| Enrichment Score (ES) | -0.7063956 |
| Normalized Enrichment Score (NES) | -1.8090216 |
| Nominal p-value | 0.0 |
| FDR q-value | 0.013525763 |
| FWER p-Value | 0.098 |
| PROBE | DESCRIPTION (from dataset) | GENE SYMBOL | GENE_TITLE | RANK IN GENE LIST | RANK METRIC SCORE | RUNNING ES | CORE ENRICHMENT | |
|---|---|---|---|---|---|---|---|---|
| 1 | EGR1 | 4610347 | 861 | 2.187 | -0.0114 | No | ||
| 2 | ASF1B | 6590706 | 1701 | 1.450 | -0.0335 | No | ||
| 3 | RRM2 | 6350059 6940162 | 2198 | 1.075 | -0.0430 | No | ||
| 4 | DEK | 1050451 4560037 | 2505 | 0.906 | -0.0450 | No | ||
| 5 | ANKRD25 | 4850102 | 2937 | 0.677 | -0.0574 | No | ||
| 6 | ATAD2 | 870242 2260687 | 3521 | 0.464 | -0.0814 | No | ||
| 7 | CENPK | 1740722 6200068 | 3642 | 0.431 | -0.0810 | No | ||
| 8 | CDCA5 | 5670131 | 3717 | 0.414 | -0.0784 | No | ||
| 9 | VRK1 | 5890603 6900347 | 4719 | 0.239 | -0.1285 | No | ||
| 10 | PBX3 | 1300424 3710577 6180575 | 4738 | 0.236 | -0.1257 | No | ||
| 11 | MCM8 | 6130743 | 6068 | 0.120 | -0.1953 | No | ||
| 12 | KCNK1 | 1050068 | 8222 | 0.045 | -0.3106 | No | ||
| 13 | PTX3 | 870309 3520102 | 9822 | 0.014 | -0.3965 | No | ||
| 14 | EPS8 | 7050204 | 9837 | 0.014 | -0.3970 | No | ||
| 15 | NPAT | 3800594 4670026 | 9927 | 0.012 | -0.4016 | No | ||
| 16 | FBXO5 | 2630551 | 10381 | 0.005 | -0.4260 | No | ||
| 17 | CCDC5 | 2480040 | 10906 | -0.004 | -0.4541 | No | ||
| 18 | BTG3 | 7050079 | 11423 | -0.013 | -0.4817 | No | ||
| 19 | SLBP | 6220601 | 11603 | -0.016 | -0.4911 | No | ||
| 20 | ESCO2 | 1170010 | 12108 | -0.027 | -0.5178 | No | ||
| 21 | FANCA | 6130070 | 12346 | -0.032 | -0.5301 | No | ||
| 22 | JPH1 | 610739 | 12535 | -0.037 | -0.5396 | No | ||
| 23 | HUNK | 7100139 | 12667 | -0.041 | -0.5460 | No | ||
| 24 | RAB27A | 450019 | 13418 | -0.067 | -0.5853 | No | ||
| 25 | BLM | 520619 5570170 | 13581 | -0.075 | -0.5929 | No | ||
| 26 | HMGB2 | 2640603 | 13760 | -0.085 | -0.6011 | No | ||
| 27 | SNTB2 | 2630014 5390035 | 14250 | -0.127 | -0.6254 | No | ||
| 28 | FST | 1110600 | 14496 | -0.158 | -0.6361 | No | ||
| 29 | CHAF1A | 6040647 | 14522 | -0.162 | -0.6348 | No | ||
| 30 | CDKN1A | 4050088 6400706 | 14886 | -0.231 | -0.6507 | No | ||
| 31 | BARD1 | 3170348 | 15004 | -0.261 | -0.6528 | No | ||
| 32 | MELK | 130022 5220537 | 15534 | -0.430 | -0.6745 | No | ||
| 33 | DONSON | 4780541 6130010 | 15557 | -0.438 | -0.6686 | No | ||
| 34 | CNOT6L | 4590333 | 15576 | -0.447 | -0.6625 | No | ||
| 35 | E2F2 | 5270609 5570377 7000465 | 15698 | -0.493 | -0.6611 | No | ||
| 36 | EZH2 | 6130605 6380524 | 15735 | -0.506 | -0.6550 | No | ||
| 37 | MCM7 | 3290292 5220056 | 15954 | -0.607 | -0.6570 | No | ||
| 38 | RECQL4 | 540551 | 16107 | -0.670 | -0.6545 | No | ||
| 39 | CCNE1 | 110064 | 16946 | -1.172 | -0.6809 | Yes | ||
| 40 | CDC25A | 3800184 | 17420 | -1.670 | -0.6797 | Yes | ||
| 41 | RFC3 | 1980600 | 17624 | -1.896 | -0.6604 | Yes | ||
| 42 | TFDP1 | 1980112 | 17630 | -1.906 | -0.6302 | Yes | ||
| 43 | RRM1 | 4150433 | 17904 | -2.297 | -0.6082 | Yes | ||
| 44 | FANCL | 2060520 5220066 5270164 | 18083 | -2.626 | -0.5758 | Yes | ||
| 45 | POLD3 | 6400278 | 18117 | -2.715 | -0.5342 | Yes | ||
| 46 | PCNA | 940754 | 18279 | -3.090 | -0.4935 | Yes | ||
| 47 | RFC4 | 3800082 6840142 | 18298 | -3.159 | -0.4440 | Yes | ||
| 48 | DCK | 6900411 | 18333 | -3.283 | -0.3933 | Yes | ||
| 49 | SKP2 | 360711 380093 4810368 | 18370 | -3.435 | -0.3404 | Yes | ||
| 50 | MCM4 | 2760673 5420711 | 18391 | -3.505 | -0.2855 | Yes | ||
| 51 | EED | 2320373 | 18506 | -4.095 | -0.2262 | Yes | ||
| 52 | RAD51AP1 | 4050736 6370528 | 18523 | -4.193 | -0.1600 | Yes | ||
| 53 | TMPO | 4050494 | 18542 | -4.448 | -0.0899 | Yes | ||
| 54 | CDCA4 | 5890315 6110487 | 18605 | -5.874 | 0.0006 | Yes |