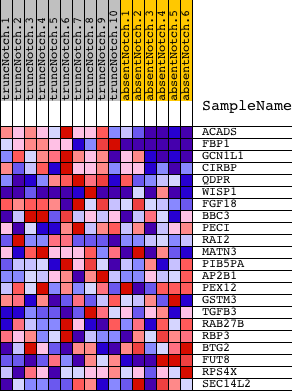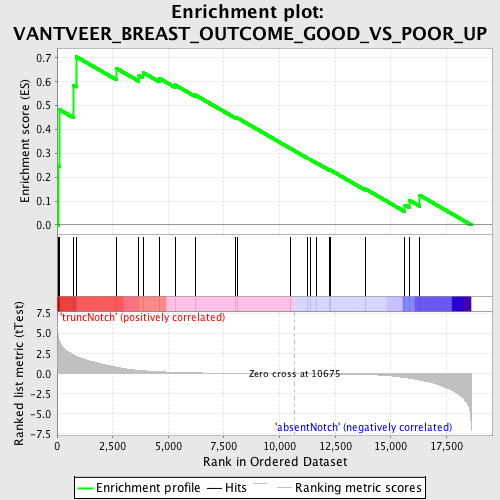
Profile of the Running ES Score & Positions of GeneSet Members on the Rank Ordered List
| Dataset | Set_03_absentNotch_versus_truncNotch.phenotype_absentNotch_versus_truncNotch.cls #truncNotch_versus_absentNotch |
| Phenotype | phenotype_absentNotch_versus_truncNotch.cls#truncNotch_versus_absentNotch |
| Upregulated in class | truncNotch |
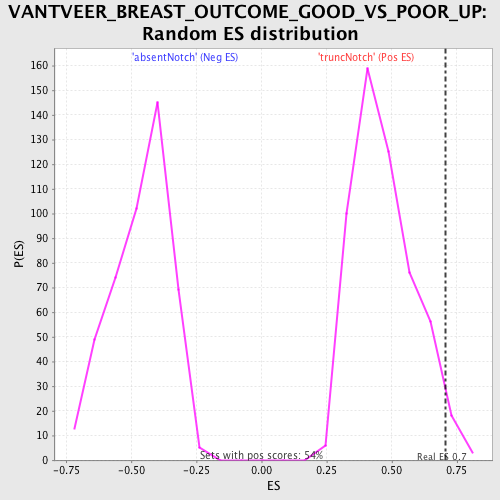
| GeneSet | VANTVEER_BREAST_OUTCOME_GOOD_VS_POOR_UP |
| Enrichment Score (ES) | 0.70442027 |
| Normalized Enrichment Score (NES) | 1.503098 |
| Nominal p-value | 0.027624309 |
| FDR q-value | 0.6400181 |
| FWER p-Value | 1.0 |
| PROBE | DESCRIPTION (from dataset) | GENE SYMBOL | GENE_TITLE | RANK IN GENE LIST | RANK METRIC SCORE | RUNNING ES | CORE ENRICHMENT | |
|---|---|---|---|---|---|---|---|---|
| 1 | ACADS | 110746 | 80 | 4.312 | 0.2471 | Yes | ||
| 2 | FBP1 | 1470762 | 104 | 4.079 | 0.4836 | Yes | ||
| 3 | GCN1L1 | 1740576 2190128 | 748 | 2.333 | 0.5850 | Yes | ||
| 4 | CIRBP | 1850408 | 878 | 2.167 | 0.7044 | Yes | ||
| 5 | QDPR | 610017 | 2654 | 0.825 | 0.6570 | No | ||
| 6 | WISP1 | 2340019 3130692 | 3678 | 0.423 | 0.6266 | No | ||
| 7 | FGF18 | 1410168 2190706 | 3860 | 0.382 | 0.6392 | No | ||
| 8 | BBC3 | 2510494 4810278 | 4584 | 0.256 | 0.6152 | No | ||
| 9 | PECI | 2190520 | 5300 | 0.174 | 0.5869 | No | ||
| 10 | RAI2 | 6770333 | 6208 | 0.113 | 0.5447 | No | ||
| 11 | MATN3 | 2570292 | 8039 | 0.049 | 0.4492 | No | ||
| 12 | PIB5PA | 6900427 | 8109 | 0.048 | 0.4483 | No | ||
| 13 | AP2B1 | 1450184 2370148 3520139 4850593 | 10505 | 0.003 | 0.3196 | No | ||
| 14 | PEX12 | 110286 | 11258 | -0.010 | 0.2797 | No | ||
| 15 | GSTM3 | 2570451 | 11397 | -0.013 | 0.2731 | No | ||
| 16 | TGFB3 | 1070041 | 11664 | -0.017 | 0.2598 | No | ||
| 17 | RAB27B | 3850524 6380647 | 12240 | -0.030 | 0.2306 | No | ||
| 18 | RBP3 | 1400059 | 12270 | -0.030 | 0.2308 | No | ||
| 19 | BTG2 | 2350411 | 13859 | -0.092 | 0.1508 | No | ||
| 20 | FUT8 | 1340068 2340056 | 15634 | -0.470 | 0.0827 | No | ||
| 21 | RPS4X | 2690020 | 15825 | -0.544 | 0.1042 | No | ||
| 22 | SEC14L2 | 2640370 | 16305 | -0.786 | 0.1243 | No |