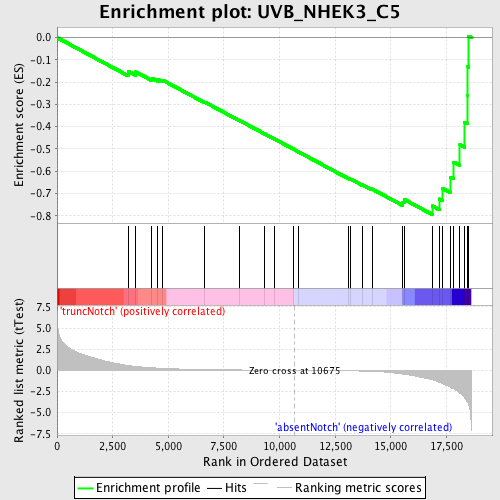
Profile of the Running ES Score & Positions of GeneSet Members on the Rank Ordered List
| Dataset | Set_03_absentNotch_versus_truncNotch.phenotype_absentNotch_versus_truncNotch.cls #truncNotch_versus_absentNotch |
| Phenotype | phenotype_absentNotch_versus_truncNotch.cls#truncNotch_versus_absentNotch |
| Upregulated in class | absentNotch |
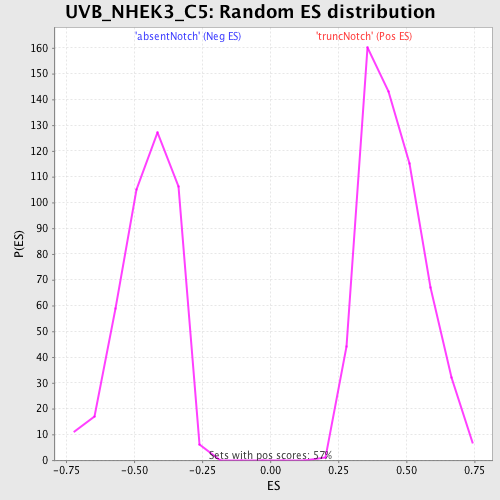
| GeneSet | UVB_NHEK3_C5 |
| Enrichment Score (ES) | -0.7943954 |
| Normalized Enrichment Score (NES) | -1.7714587 |
| Nominal p-value | 0.0 |
| FDR q-value | 0.022054287 |
| FWER p-Value | 0.195 |
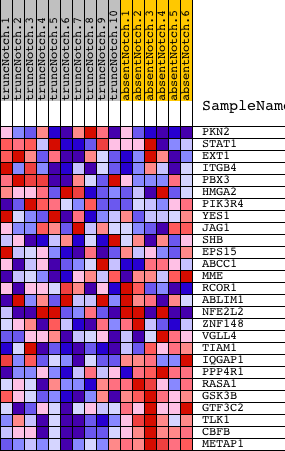
| PROBE | DESCRIPTION (from dataset) | GENE SYMBOL | GENE_TITLE | RANK IN GENE LIST | RANK METRIC SCORE | RUNNING ES | CORE ENRICHMENT | |
|---|---|---|---|---|---|---|---|---|
| 1 | PKN2 | 940746 2350168 | 3193 | 0.577 | -0.1518 | No | ||
| 2 | STAT1 | 6510204 6590553 | 3538 | 0.460 | -0.1544 | No | ||
| 3 | EXT1 | 4540603 | 4264 | 0.307 | -0.1827 | No | ||
| 4 | ITGB4 | 1740021 3840482 | 4518 | 0.265 | -0.1872 | No | ||
| 5 | PBX3 | 1300424 3710577 6180575 | 4738 | 0.236 | -0.1908 | No | ||
| 6 | HMGA2 | 2940121 3390647 5130279 6400136 | 6643 | 0.091 | -0.2900 | No | ||
| 7 | PIK3R4 | 1990132 | 8201 | 0.045 | -0.3722 | No | ||
| 8 | YES1 | 6100050 | 9343 | 0.022 | -0.4328 | No | ||
| 9 | JAG1 | 3440390 | 9767 | 0.015 | -0.4551 | No | ||
| 10 | SHB | 4920494 | 10628 | 0.001 | -0.5013 | No | ||
| 11 | EPS15 | 4200215 | 10846 | -0.003 | -0.5129 | No | ||
| 12 | ABCC1 | 4760722 6770280 | 13099 | -0.054 | -0.6321 | No | ||
| 13 | MME | 6040673 | 13208 | -0.058 | -0.6359 | No | ||
| 14 | RCOR1 | 5360717 | 13706 | -0.082 | -0.6598 | No | ||
| 15 | ABLIM1 | 580170 3710338 6520504 | 14156 | -0.117 | -0.6799 | No | ||
| 16 | NFE2L2 | 2810619 3390162 | 15541 | -0.432 | -0.7394 | No | ||
| 17 | ZNF148 | 6420403 | 15604 | -0.459 | -0.7268 | No | ||
| 18 | VGLL4 | 6860463 | 16861 | -1.106 | -0.7561 | Yes | ||
| 19 | TIAM1 | 5420288 | 17196 | -1.424 | -0.7248 | Yes | ||
| 20 | IQGAP1 | 6660494 | 17330 | -1.572 | -0.6775 | Yes | ||
| 21 | PPP4R1 | 5670088 6420402 | 17688 | -2.007 | -0.6273 | Yes | ||
| 22 | RASA1 | 1240315 | 17822 | -2.176 | -0.5591 | Yes | ||
| 23 | GSK3B | 5360348 | 18106 | -2.696 | -0.4810 | Yes | ||
| 24 | GTF3C2 | 670494 | 18314 | -3.221 | -0.3806 | Yes | ||
| 25 | TLK1 | 7100605 | 18433 | -3.696 | -0.2591 | Yes | ||
| 26 | CBFB | 1850551 2650035 | 18440 | -3.732 | -0.1302 | Yes | ||
| 27 | METAP1 | 3520632 | 18495 | -4.035 | 0.0065 | Yes |