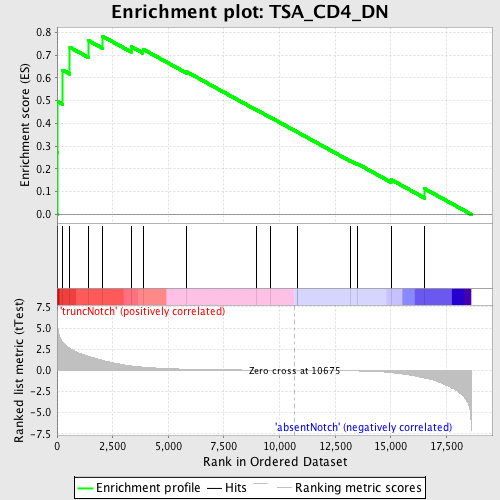
Profile of the Running ES Score & Positions of GeneSet Members on the Rank Ordered List
| Dataset | Set_03_absentNotch_versus_truncNotch.phenotype_absentNotch_versus_truncNotch.cls #truncNotch_versus_absentNotch |
| Phenotype | phenotype_absentNotch_versus_truncNotch.cls#truncNotch_versus_absentNotch |
| Upregulated in class | truncNotch |
| GeneSet | TSA_CD4_DN |
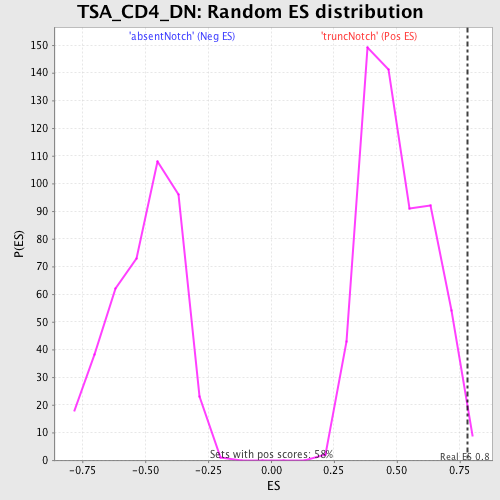
| Enrichment Score (ES) | 0.7829491 |
| Normalized Enrichment Score (NES) | 1.5654312 |
| Nominal p-value | 0.012048192 |
| FDR q-value | 0.3666312 |
| FWER p-Value | 0.997 |
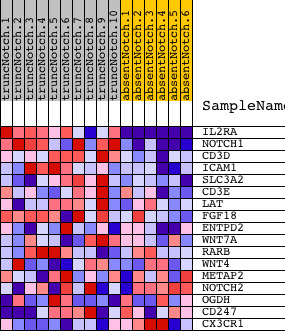
| PROBE | DESCRIPTION (from dataset) | GENE SYMBOL | GENE_TITLE | RANK IN GENE LIST | RANK METRIC SCORE | RUNNING ES | CORE ENRICHMENT | |
|---|---|---|---|---|---|---|---|---|
| 1 | IL2RA | 6620450 | 8 | 6.074 | 0.2730 | Yes | ||
| 2 | NOTCH1 | 3390114 | 35 | 4.954 | 0.4947 | Yes | ||
| 3 | CD3D | 2810739 | 251 | 3.343 | 0.6337 | Yes | ||
| 4 | ICAM1 | 6980138 | 577 | 2.609 | 0.7337 | Yes | ||
| 5 | SLC3A2 | 5270358 | 1395 | 1.649 | 0.7640 | Yes | ||
| 6 | CD3E | 3800056 | 2032 | 1.180 | 0.7829 | Yes | ||
| 7 | LAT | 3170025 | 3335 | 0.527 | 0.7367 | No | ||
| 8 | FGF18 | 1410168 2190706 | 3860 | 0.382 | 0.7257 | No | ||
| 9 | ENTPD2 | 4590739 | 5819 | 0.136 | 0.6266 | No | ||
| 10 | WNT7A | 1170315 | 8951 | 0.030 | 0.4596 | No | ||
| 11 | RARB | 430139 1410138 | 9596 | 0.018 | 0.4257 | No | ||
| 12 | WNT4 | 4150619 | 10808 | -0.002 | 0.3607 | No | ||
| 13 | METAP2 | 1570441 4010026 4850204 | 10821 | -0.002 | 0.3602 | No | ||
| 14 | NOTCH2 | 2570397 | 13205 | -0.058 | 0.2347 | No | ||
| 15 | OGDH | 3840333 6350100 | 13513 | -0.071 | 0.2214 | No | ||
| 16 | CD247 | 3800725 5720136 | 15011 | -0.264 | 0.1528 | No | ||
| 17 | CX3CR1 | 1690577 | 16525 | -0.910 | 0.1124 | No |