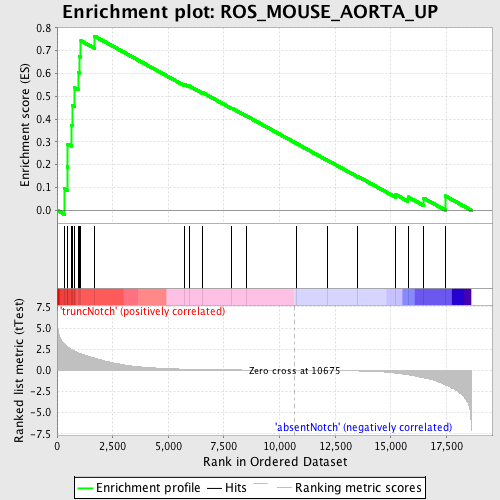
Profile of the Running ES Score & Positions of GeneSet Members on the Rank Ordered List
| Dataset | Set_03_absentNotch_versus_truncNotch.phenotype_absentNotch_versus_truncNotch.cls #truncNotch_versus_absentNotch |
| Phenotype | phenotype_absentNotch_versus_truncNotch.cls#truncNotch_versus_absentNotch |
| Upregulated in class | truncNotch |
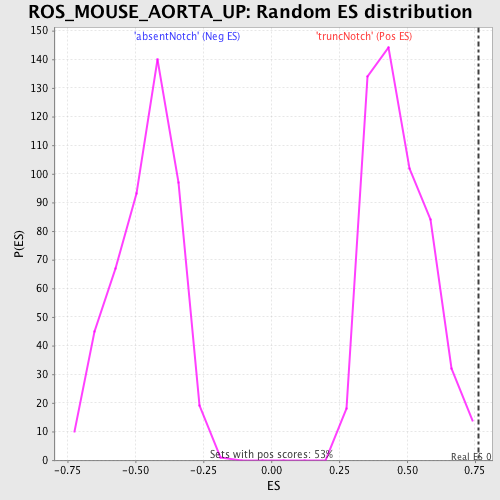
| GeneSet | ROS_MOUSE_AORTA_UP |
| Enrichment Score (ES) | 0.7639597 |
| Normalized Enrichment Score (NES) | 1.6329036 |
| Nominal p-value | 0.0018939395 |
| FDR q-value | 0.24739613 |
| FWER p-Value | 0.854 |
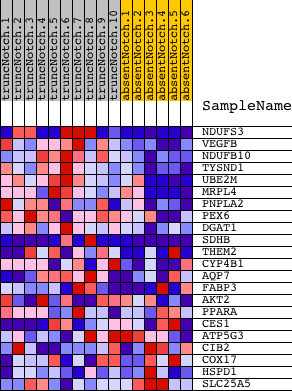
| PROBE | DESCRIPTION (from dataset) | GENE SYMBOL | GENE_TITLE | RANK IN GENE LIST | RANK METRIC SCORE | RUNNING ES | CORE ENRICHMENT | |
|---|---|---|---|---|---|---|---|---|
| 1 | NDUFS3 | 1690136 5340528 | 343 | 3.073 | 0.0939 | Yes | ||
| 2 | VEGFB | 5360152 | 454 | 2.797 | 0.1902 | Yes | ||
| 3 | NDUFB10 | 5900576 | 470 | 2.769 | 0.2906 | Yes | ||
| 4 | TYSND1 | 2940273 | 648 | 2.496 | 0.3724 | Yes | ||
| 5 | UBE2M | 2450215 | 678 | 2.444 | 0.4601 | Yes | ||
| 6 | MRPL4 | 2680050 | 796 | 2.270 | 0.5368 | Yes | ||
| 7 | PNPLA2 | 4920520 | 943 | 2.077 | 0.6049 | Yes | ||
| 8 | PEX6 | 2100253 6660162 | 999 | 2.024 | 0.6759 | Yes | ||
| 9 | DGAT1 | 1850538 | 1070 | 1.947 | 0.7434 | Yes | ||
| 10 | SDHB | 3120398 4780113 3710435 | 1682 | 1.463 | 0.7640 | Yes | ||
| 11 | THEM2 | 6840746 | 5742 | 0.142 | 0.5509 | No | ||
| 12 | CYP4B1 | 2570139 | 5931 | 0.128 | 0.5454 | No | ||
| 13 | AQP7 | 2760576 2810072 2940722 | 6546 | 0.095 | 0.5159 | No | ||
| 14 | FABP3 | 6860452 | 7835 | 0.054 | 0.4486 | No | ||
| 15 | AKT2 | 3850541 3870519 | 8506 | 0.039 | 0.4140 | No | ||
| 16 | PPARA | 2060026 | 10754 | -0.001 | 0.2932 | No | ||
| 17 | CES1 | 1400494 | 12152 | -0.028 | 0.2191 | No | ||
| 18 | ATP5G3 | 4230551 | 13521 | -0.072 | 0.1482 | No | ||
| 19 | CIB2 | 1740131 4760594 | 15221 | -0.330 | 0.0689 | No | ||
| 20 | COX17 | 6250072 | 15772 | -0.524 | 0.0584 | No | ||
| 21 | HSPD1 | 60097 2030451 | 16481 | -0.887 | 0.0528 | No | ||
| 22 | SLC25A5 | 1980672 | 17447 | -1.696 | 0.0629 | No |