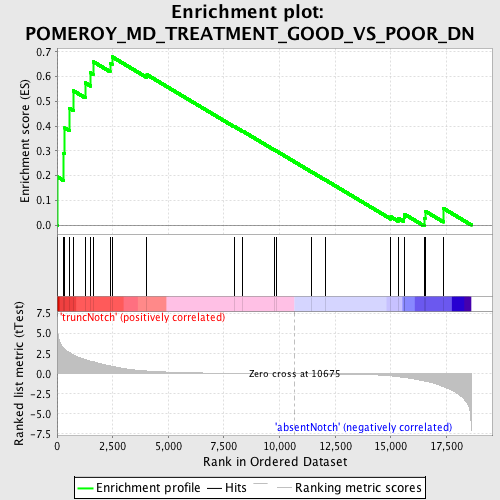
Profile of the Running ES Score & Positions of GeneSet Members on the Rank Ordered List
| Dataset | Set_03_absentNotch_versus_truncNotch.phenotype_absentNotch_versus_truncNotch.cls #truncNotch_versus_absentNotch |
| Phenotype | phenotype_absentNotch_versus_truncNotch.cls#truncNotch_versus_absentNotch |
| Upregulated in class | truncNotch |
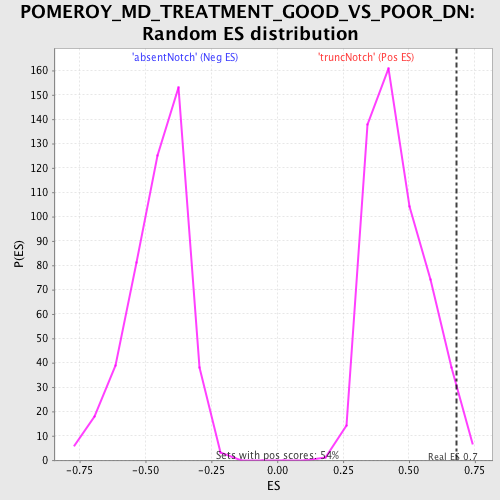
| GeneSet | POMEROY_MD_TREATMENT_GOOD_VS_POOR_DN |
| Enrichment Score (ES) | 0.68009055 |
| Normalized Enrichment Score (NES) | 1.4948877 |
| Nominal p-value | 0.018621974 |
| FDR q-value | 0.5942188 |
| FWER p-Value | 1.0 |
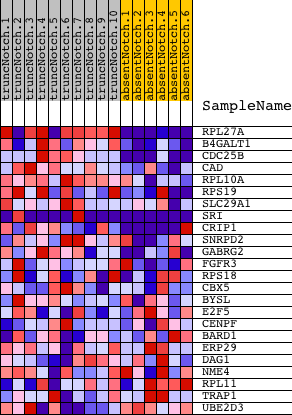
| PROBE | DESCRIPTION (from dataset) | GENE SYMBOL | GENE_TITLE | RANK IN GENE LIST | RANK METRIC SCORE | RUNNING ES | CORE ENRICHMENT | |
|---|---|---|---|---|---|---|---|---|
| 1 | RPL27A | 3130451 110195 6840494 | 17 | 5.709 | 0.1946 | Yes | ||
| 2 | B4GALT1 | 6980167 | 291 | 3.225 | 0.2904 | Yes | ||
| 3 | CDC25B | 6940102 | 346 | 3.071 | 0.3927 | Yes | ||
| 4 | CAD | 2340717 | 555 | 2.636 | 0.4718 | Yes | ||
| 5 | RPL10A | 4850066 | 734 | 2.356 | 0.5429 | Yes | ||
| 6 | RPS19 | 5860066 | 1263 | 1.767 | 0.5750 | Yes | ||
| 7 | SLC29A1 | 2970379 | 1508 | 1.566 | 0.6155 | Yes | ||
| 8 | SRI | 3390446 4850064 | 1620 | 1.497 | 0.6608 | Yes | ||
| 9 | CRIP1 | 4590377 | 2382 | 0.980 | 0.6535 | Yes | ||
| 10 | SNRPD2 | 6110035 | 2476 | 0.923 | 0.6801 | Yes | ||
| 11 | GABRG2 | 2350402 4210204 6130279 6550037 | 4039 | 0.345 | 0.6079 | No | ||
| 12 | FGFR3 | 5390632 6020021 | 7957 | 0.051 | 0.3990 | No | ||
| 13 | RPS18 | 670132 1230148 2030722 | 8353 | 0.042 | 0.3792 | No | ||
| 14 | CBX5 | 3830072 6290167 | 9780 | 0.015 | 0.3030 | No | ||
| 15 | BYSL | 3170110 | 9874 | 0.013 | 0.2984 | No | ||
| 16 | E2F5 | 5860575 | 11453 | -0.014 | 0.2140 | No | ||
| 17 | CENPF | 5050088 | 12052 | -0.026 | 0.1828 | No | ||
| 18 | BARD1 | 3170348 | 15004 | -0.261 | 0.0330 | No | ||
| 19 | ERP29 | 4050441 | 15328 | -0.359 | 0.0279 | No | ||
| 20 | DAG1 | 460053 610341 | 15592 | -0.453 | 0.0293 | No | ||
| 21 | NME4 | 3140736 5900446 | 15607 | -0.460 | 0.0443 | No | ||
| 22 | RPL11 | 3780435 | 16502 | -0.897 | 0.0270 | No | ||
| 23 | TRAP1 | 6040168 | 16542 | -0.920 | 0.0564 | No | ||
| 24 | UBE2D3 | 3190452 | 17364 | -1.609 | 0.0673 | No |