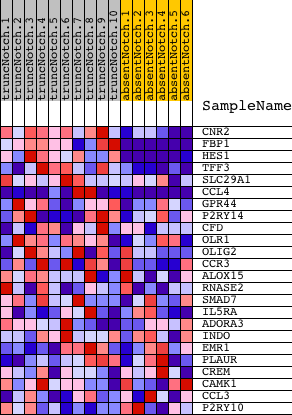
Profile of the Running ES Score & Positions of GeneSet Members on the Rank Ordered List
| Dataset | Set_03_absentNotch_versus_truncNotch.phenotype_absentNotch_versus_truncNotch.cls #truncNotch_versus_absentNotch |
| Phenotype | phenotype_absentNotch_versus_truncNotch.cls#truncNotch_versus_absentNotch |
| Upregulated in class | truncNotch |
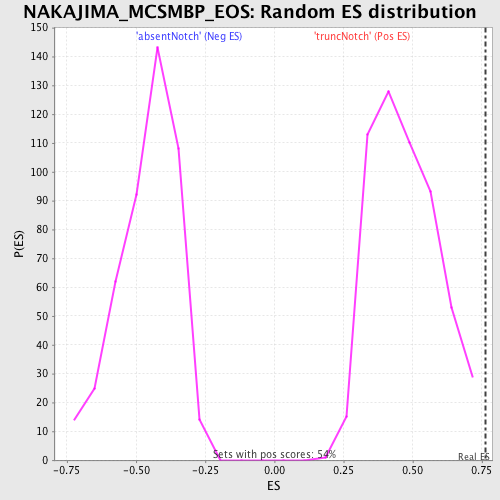
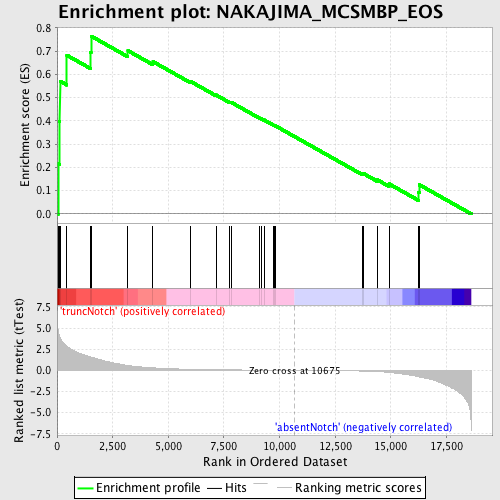
| GeneSet | NAKAJIMA_MCSMBP_EOS |
| Enrichment Score (ES) | 0.7647603 |
| Normalized Enrichment Score (NES) | 1.6238923 |
| Nominal p-value | 0.0 |
| FDR q-value | 0.21761976 |
| FWER p-Value | 0.894 |
| PROBE | DESCRIPTION (from dataset) | GENE SYMBOL | GENE_TITLE | RANK IN GENE LIST | RANK METRIC SCORE | RUNNING ES | CORE ENRICHMENT | |
|---|---|---|---|---|---|---|---|---|
| 1 | CNR2 | 2760398 | 42 | 4.829 | 0.2159 | Yes | ||
| 2 | FBP1 | 1470762 | 104 | 4.079 | 0.3968 | Yes | ||
| 3 | HES1 | 4810280 | 129 | 3.885 | 0.5710 | Yes | ||
| 4 | TFF3 | 1580129 | 439 | 2.835 | 0.6824 | Yes | ||
| 5 | SLC29A1 | 2970379 | 1508 | 1.566 | 0.6958 | Yes | ||
| 6 | CCL4 | 50368 430047 | 1528 | 1.550 | 0.7648 | Yes | ||
| 7 | GPR44 | 4050452 | 3184 | 0.581 | 0.7020 | No | ||
| 8 | P2RY14 | 6100497 | 4309 | 0.298 | 0.6550 | No | ||
| 9 | CFD | 2320736 | 5983 | 0.125 | 0.5707 | No | ||
| 10 | OLR1 | 50025 3840484 | 7141 | 0.073 | 0.5117 | No | ||
| 11 | OLIG2 | 6660402 | 7760 | 0.055 | 0.4810 | No | ||
| 12 | CCR3 | 50427 | 7816 | 0.055 | 0.4805 | No | ||
| 13 | ALOX15 | 6620333 | 9107 | 0.027 | 0.4124 | No | ||
| 14 | RNASE2 | 3290563 | 9193 | 0.025 | 0.4089 | No | ||
| 15 | SMAD7 | 430377 | 9300 | 0.023 | 0.4043 | No | ||
| 16 | IL5RA | 4540091 | 9742 | 0.015 | 0.3812 | No | ||
| 17 | ADORA3 | 630333 | 9761 | 0.015 | 0.3809 | No | ||
| 18 | INDO | 2680390 | 9825 | 0.014 | 0.3782 | No | ||
| 19 | EMR1 | 70136 1500592 | 13722 | -0.083 | 0.1724 | No | ||
| 20 | PLAUR | 5910280 | 13758 | -0.085 | 0.1744 | No | ||
| 21 | CREM | 840156 6380438 6660041 6660168 | 14395 | -0.144 | 0.1466 | No | ||
| 22 | CAMK1 | 3390427 5220086 6940504 | 14920 | -0.241 | 0.1293 | No | ||
| 23 | CCL3 | 2810092 | 16253 | -0.760 | 0.0920 | No | ||
| 24 | P2RY10 | 6370039 6840204 | 16285 | -0.775 | 0.1254 | No |