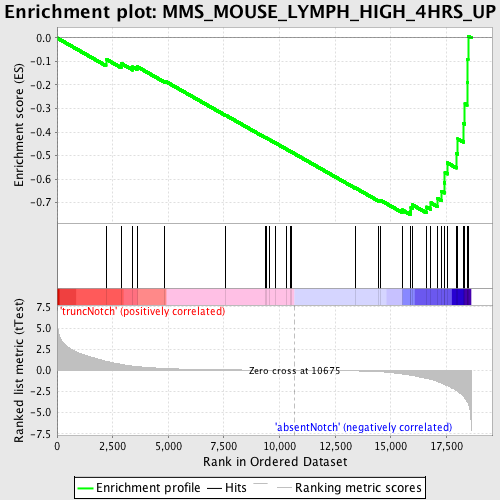
Profile of the Running ES Score & Positions of GeneSet Members on the Rank Ordered List
| Dataset | Set_03_absentNotch_versus_truncNotch.phenotype_absentNotch_versus_truncNotch.cls #truncNotch_versus_absentNotch |
| Phenotype | phenotype_absentNotch_versus_truncNotch.cls#truncNotch_versus_absentNotch |
| Upregulated in class | absentNotch |
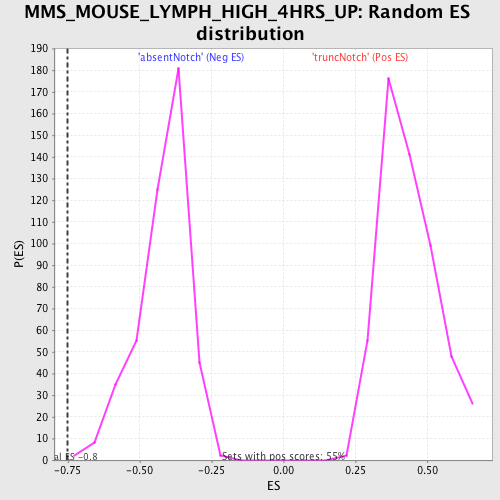
| GeneSet | MMS_MOUSE_LYMPH_HIGH_4HRS_UP |
| Enrichment Score (ES) | -0.7507117 |
| Normalized Enrichment Score (NES) | -1.7965102 |
| Nominal p-value | 0.0022075055 |
| FDR q-value | 0.014433989 |
| FWER p-Value | 0.119 |
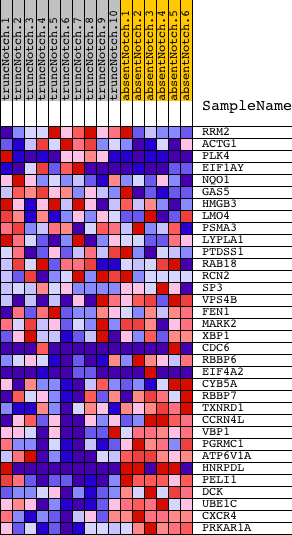
| PROBE | DESCRIPTION (from dataset) | GENE SYMBOL | GENE_TITLE | RANK IN GENE LIST | RANK METRIC SCORE | RUNNING ES | CORE ENRICHMENT | |
|---|---|---|---|---|---|---|---|---|
| 1 | RRM2 | 6350059 6940162 | 2198 | 1.075 | -0.0901 | No | ||
| 2 | ACTG1 | 540215 | 2877 | 0.702 | -0.1082 | No | ||
| 3 | PLK4 | 430162 5720110 | 3404 | 0.506 | -0.1232 | No | ||
| 4 | EIF1AY | 1230541 6130301 | 3595 | 0.443 | -0.1218 | No | ||
| 5 | NQO1 | 3450136 6840121 | 4847 | 0.226 | -0.1832 | No | ||
| 6 | GAS5 | 1980136 4210551 | 7575 | 0.060 | -0.3284 | No | ||
| 7 | HMGB3 | 2940168 | 9356 | 0.022 | -0.4236 | No | ||
| 8 | LMO4 | 3800746 | 9397 | 0.021 | -0.4252 | No | ||
| 9 | PSMA3 | 5900047 7040161 | 9538 | 0.019 | -0.4322 | No | ||
| 10 | LYPLA1 | 4480373 5570551 | 9799 | 0.015 | -0.4458 | No | ||
| 11 | PTDSS1 | 6020215 | 10310 | 0.006 | -0.4731 | No | ||
| 12 | RAB18 | 3120575 4590577 | 10497 | 0.003 | -0.4831 | No | ||
| 13 | RCN2 | 840324 | 10556 | 0.002 | -0.4862 | No | ||
| 14 | SP3 | 3840338 | 13400 | -0.066 | -0.6374 | No | ||
| 15 | VPS4B | 3440332 | 14467 | -0.154 | -0.6907 | No | ||
| 16 | FEN1 | 1770541 | 14554 | -0.166 | -0.6910 | No | ||
| 17 | MARK2 | 7210608 | 15510 | -0.424 | -0.7313 | No | ||
| 18 | XBP1 | 3840594 | 15872 | -0.564 | -0.7359 | Yes | ||
| 19 | CDC6 | 4570296 5360600 | 15903 | -0.578 | -0.7224 | Yes | ||
| 20 | RBBP6 | 2320129 | 15969 | -0.613 | -0.7098 | Yes | ||
| 21 | EIF4A2 | 1170494 1740711 2850504 | 16605 | -0.958 | -0.7189 | Yes | ||
| 22 | CYB5A | 5080450 | 16804 | -1.069 | -0.7015 | Yes | ||
| 23 | RBBP7 | 430113 450450 2370309 | 17109 | -1.334 | -0.6829 | Yes | ||
| 24 | TXNRD1 | 6590446 | 17271 | -1.508 | -0.6520 | Yes | ||
| 25 | CCRN4L | 50438 5130372 | 17411 | -1.663 | -0.6159 | Yes | ||
| 26 | VBP1 | 4070050 | 17434 | -1.688 | -0.5728 | Yes | ||
| 27 | PGRMC1 | 4150692 | 17543 | -1.808 | -0.5312 | Yes | ||
| 28 | ATP6V1A | 6590242 | 17950 | -2.364 | -0.4911 | Yes | ||
| 29 | HNRPDL | 1050102 1090181 5360471 | 18013 | -2.480 | -0.4294 | Yes | ||
| 30 | PELI1 | 3870215 6900040 | 18263 | -3.055 | -0.3627 | Yes | ||
| 31 | DCK | 6900411 | 18333 | -3.283 | -0.2804 | Yes | ||
| 32 | UBE1C | 6040341 | 18426 | -3.659 | -0.1894 | Yes | ||
| 33 | CXCR4 | 4590519 | 18442 | -3.739 | -0.0922 | Yes | ||
| 34 | PRKAR1A | 3450369 | 18471 | -3.872 | 0.0078 | Yes |