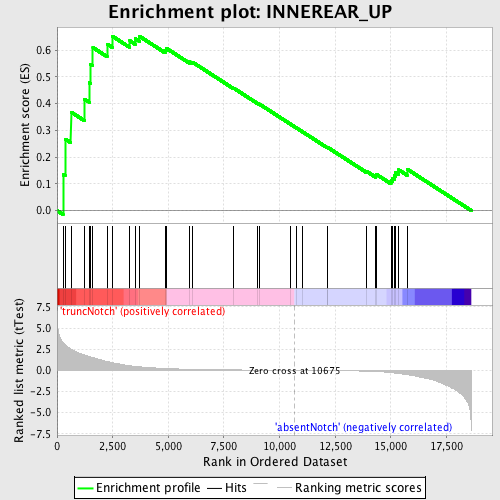
Profile of the Running ES Score & Positions of GeneSet Members on the Rank Ordered List
| Dataset | Set_03_absentNotch_versus_truncNotch.phenotype_absentNotch_versus_truncNotch.cls #truncNotch_versus_absentNotch |
| Phenotype | phenotype_absentNotch_versus_truncNotch.cls#truncNotch_versus_absentNotch |
| Upregulated in class | truncNotch |
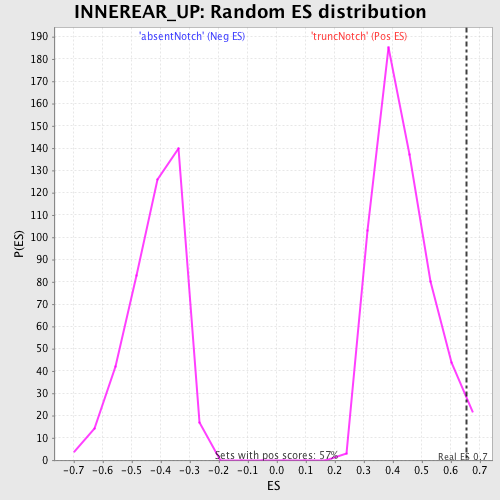
| GeneSet | INNEREAR_UP |
| Enrichment Score (ES) | 0.6524252 |
| Normalized Enrichment Score (NES) | 1.4966344 |
| Nominal p-value | 0.027874565 |
| FDR q-value | 0.6149147 |
| FWER p-Value | 1.0 |
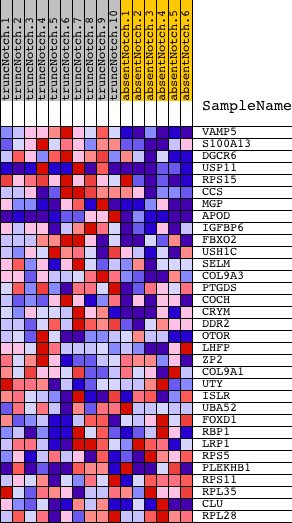
| PROBE | DESCRIPTION (from dataset) | GENE SYMBOL | GENE_TITLE | RANK IN GENE LIST | RANK METRIC SCORE | RUNNING ES | CORE ENRICHMENT | |
|---|---|---|---|---|---|---|---|---|
| 1 | VAMP5 | 3830300 | 269 | 3.288 | 0.1350 | Yes | ||
| 2 | S100A13 | 520019 | 362 | 3.031 | 0.2677 | Yes | ||
| 3 | DGCR6 | 5890129 | 624 | 2.527 | 0.3685 | Yes | ||
| 4 | USP11 | 6370408 6520193 | 1239 | 1.782 | 0.4165 | Yes | ||
| 5 | RPS15 | 580100 | 1446 | 1.609 | 0.4785 | Yes | ||
| 6 | CCS | 3450524 | 1493 | 1.576 | 0.5476 | Yes | ||
| 7 | MGP | 6900736 | 1610 | 1.501 | 0.6096 | Yes | ||
| 8 | APOD | 4920441 | 2248 | 1.046 | 0.6229 | Yes | ||
| 9 | IGFBP6 | 1580181 | 2478 | 0.921 | 0.6524 | Yes | ||
| 10 | FBXO2 | 6510091 | 3269 | 0.549 | 0.6348 | No | ||
| 11 | USH1C | 1570372 4230364 | 3509 | 0.468 | 0.6432 | No | ||
| 12 | SELM | 450458 | 3703 | 0.418 | 0.6518 | No | ||
| 13 | COL9A3 | 4050541 | 4859 | 0.224 | 0.5998 | No | ||
| 14 | PTGDS | 3610519 | 4907 | 0.217 | 0.6072 | No | ||
| 15 | COCH | 1090136 | 5950 | 0.127 | 0.5569 | No | ||
| 16 | CRYM | 3940528 | 6082 | 0.119 | 0.5553 | No | ||
| 17 | DDR2 | 7050273 | 7929 | 0.052 | 0.4583 | No | ||
| 18 | OTOR | 3440010 | 9008 | 0.029 | 0.4016 | No | ||
| 19 | LHFP | 3440368 | 9087 | 0.027 | 0.3986 | No | ||
| 20 | ZP2 | 1580408 | 10509 | 0.003 | 0.3223 | No | ||
| 21 | COL9A1 | 4570369 7100446 | 10777 | -0.002 | 0.3080 | No | ||
| 22 | UTY | 5890441 | 11032 | -0.006 | 0.2946 | No | ||
| 23 | ISLR | 110273 6450368 | 12132 | -0.027 | 0.2367 | No | ||
| 24 | UBA52 | 6180288 | 12169 | -0.028 | 0.2360 | No | ||
| 25 | FOXD1 | 6860053 | 13908 | -0.096 | 0.1469 | No | ||
| 26 | RBP1 | 1690072 | 14317 | -0.135 | 0.1311 | No | ||
| 27 | LRP1 | 6270386 | 14339 | -0.137 | 0.1362 | No | ||
| 28 | RPS5 | 580093 | 15010 | -0.263 | 0.1121 | No | ||
| 29 | PLEKHB1 | 3120039 4050270 540546 870463 | 15076 | -0.283 | 0.1215 | No | ||
| 30 | RPS11 | 4120403 | 15169 | -0.312 | 0.1307 | No | ||
| 31 | RPL35 | 6940070 | 15206 | -0.325 | 0.1435 | No | ||
| 32 | CLU | 5420075 | 15358 | -0.372 | 0.1523 | No | ||
| 33 | RPL28 | 6900136 | 15733 | -0.505 | 0.1551 | No |