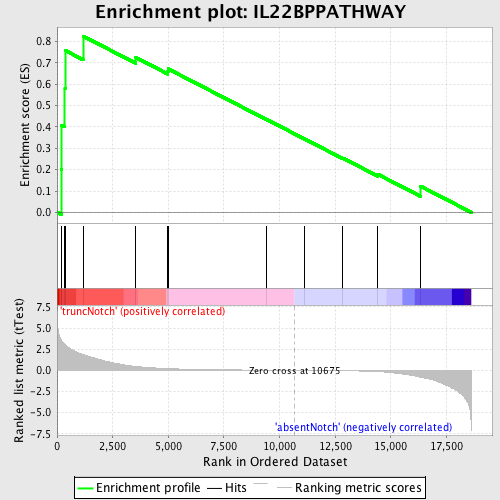
Profile of the Running ES Score & Positions of GeneSet Members on the Rank Ordered List
| Dataset | Set_03_absentNotch_versus_truncNotch.phenotype_absentNotch_versus_truncNotch.cls #truncNotch_versus_absentNotch |
| Phenotype | phenotype_absentNotch_versus_truncNotch.cls#truncNotch_versus_absentNotch |
| Upregulated in class | truncNotch |
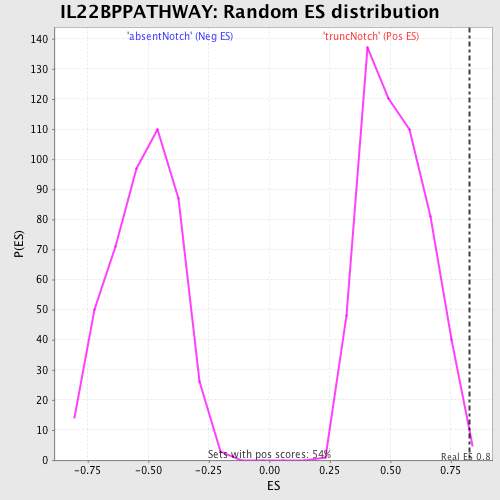
| GeneSet | IL22BPPATHWAY |
| Enrichment Score (ES) | 0.82492673 |
| Normalized Enrichment Score (NES) | 1.5862527 |
| Nominal p-value | 0.003690037 |
| FDR q-value | 0.28932095 |
| FWER p-Value | 0.986 |
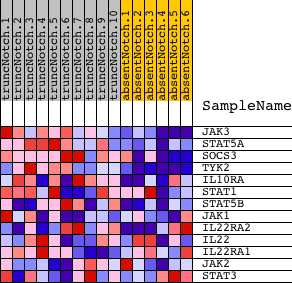
| PROBE | DESCRIPTION (from dataset) | GENE SYMBOL | GENE_TITLE | RANK IN GENE LIST | RANK METRIC SCORE | RUNNING ES | CORE ENRICHMENT | |
|---|---|---|---|---|---|---|---|---|
| 1 | JAK3 | 70347 3290008 | 183 | 3.588 | 0.2027 | Yes | ||
| 2 | STAT5A | 2680458 | 210 | 3.478 | 0.4074 | Yes | ||
| 3 | SOCS3 | 5550563 | 353 | 3.056 | 0.5808 | Yes | ||
| 4 | TYK2 | 1660465 1740736 | 372 | 2.995 | 0.7572 | Yes | ||
| 5 | IL10RA | 1770164 | 1168 | 1.864 | 0.8249 | Yes | ||
| 6 | STAT1 | 6510204 6590553 | 3538 | 0.460 | 0.7249 | No | ||
| 7 | STAT5B | 6200026 | 4979 | 0.210 | 0.6599 | No | ||
| 8 | JAK1 | 5910746 | 4994 | 0.207 | 0.6714 | No | ||
| 9 | IL22RA2 | 460113 | 9401 | 0.021 | 0.4358 | No | ||
| 10 | IL22 | 1660102 | 11120 | -0.008 | 0.3439 | No | ||
| 11 | IL22RA1 | 5720603 | 12844 | -0.046 | 0.2540 | No | ||
| 12 | JAK2 | 3780528 6100692 6550577 | 14411 | -0.147 | 0.1785 | No | ||
| 13 | STAT3 | 460040 3710341 | 16330 | -0.801 | 0.1229 | No |